> ## Documentation Index
> Fetch the complete documentation index at: https://syteca.com/docs/llms.txt
> Use this file to discover all available pages before exploring further.
# System Health Dashboards
> Monitor Syteca system state in the Management Tool - Storage Usage, CPU, Memory, Database State, and Client status - on customizable, real-time dashboards.
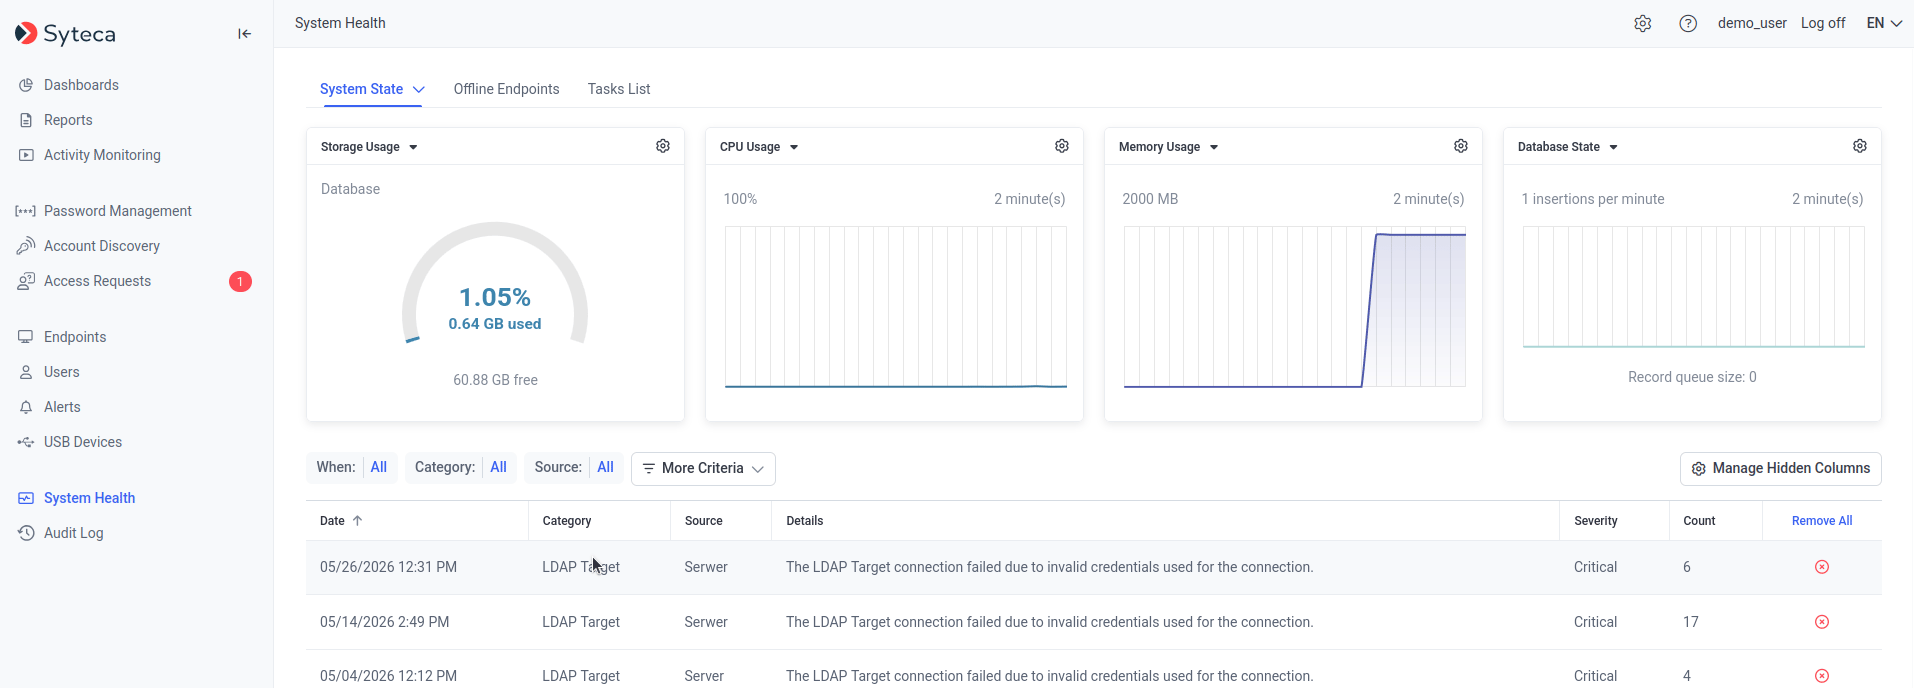
The **System Health** page shows the state of your Syteca deployment on five customizable dashboards: four on the **System State** tab (Storage Usage, CPU Usage, Memory Usage, Database State) and one on the **Offline Clients** tab (Clients). Use them to keep an eye on resource consumption, database write throughput, and Client connectivity.
This functionality is **not available in SaaS** for the four System State dashboards. The Clients dashboard is available on all deployments.
This page covers the dashboards on the **System Health** page. A separate set of user-productivity dashboards lives on the [Dashboards page](/docs/session-monitoring/dashboards/user-activity-dashboards) - different page, different audience.
The dashboards are user-specific, and your customizations (layout, sizes, colors, settings) are stored on the Application Server - so the dashboards look the same when you sign in from any other computer.
## Dashboard reference
Each dashboard has its own configuration accessed by clicking the cog icon in its top right. All dashboards check user permissions: if you don't have the required permission, the dashboard is empty (or hidden from the **Add** drop-down).
### Storage Usage
Shows disk space consumption, depending on how binary data storage is configured:
* **Binary data in SQL database** - a single **Database** pie chart shows disk space used by the database (including binary data) and remaining free space.
* **Binary data in a shared or local folder** - two pie charts: **Database** (disk space used by the database alone) and **Binary Data** (disk space used by binary data).
| Setting | What it controls |
| ---------------------------------------------- | --------------------------------------------------------------------------- |
| **Critical free space size (GB)** | The free-space threshold for the low-space warning. |
| **Used storage size color** | Color of the "used" sector. |
| **Total storage size color** | Color of the "free" sector. |
| **Warning storage size color** | Color of the "used" sector when free space is below the critical threshold. |
| **Disk space allocated for the database (GB)** | The available disk space for the database. |
If the database was created manually or disk space isn't auto-detected, you must specify the allocated disk space in the settings before statistics can be shown.
**Requires:** [Database Management administrative permission](/docs/administration/users/administrative-permissions).
### CPU Usage
Real-time chart of CPU usage by the Application Server process, displayed in percentage terms. Updates every **5 seconds**. Setting: **Chart color**.
**Requires:** [Tenant Management and System Configuration administrative permission](/docs/administration/users/administrative-permissions).
### Memory Usage
Real-time chart of memory usage by the Application Server process (private working set), displayed in MB. Updates every **5 seconds**. Setting: **Chart color**.
**Requires:** [Tenant Management and System Configuration administrative permission](/docs/administration/users/administrative-permissions).
### Database State
The average number of times Clients write data to the database per minute, plus the current number of records queued to be written (shown at the bottom of the chart). Setting: **Chart color**.
The queue has a maximum size of **64 records**. If this limit is reached, Clients stop sending data to the Application Server and temporarily store it in their offline cache until the queue size decreases.
**Requires:** [Tenant Management and System Configuration administrative permission](/docs/administration/users/administrative-permissions).
### Clients
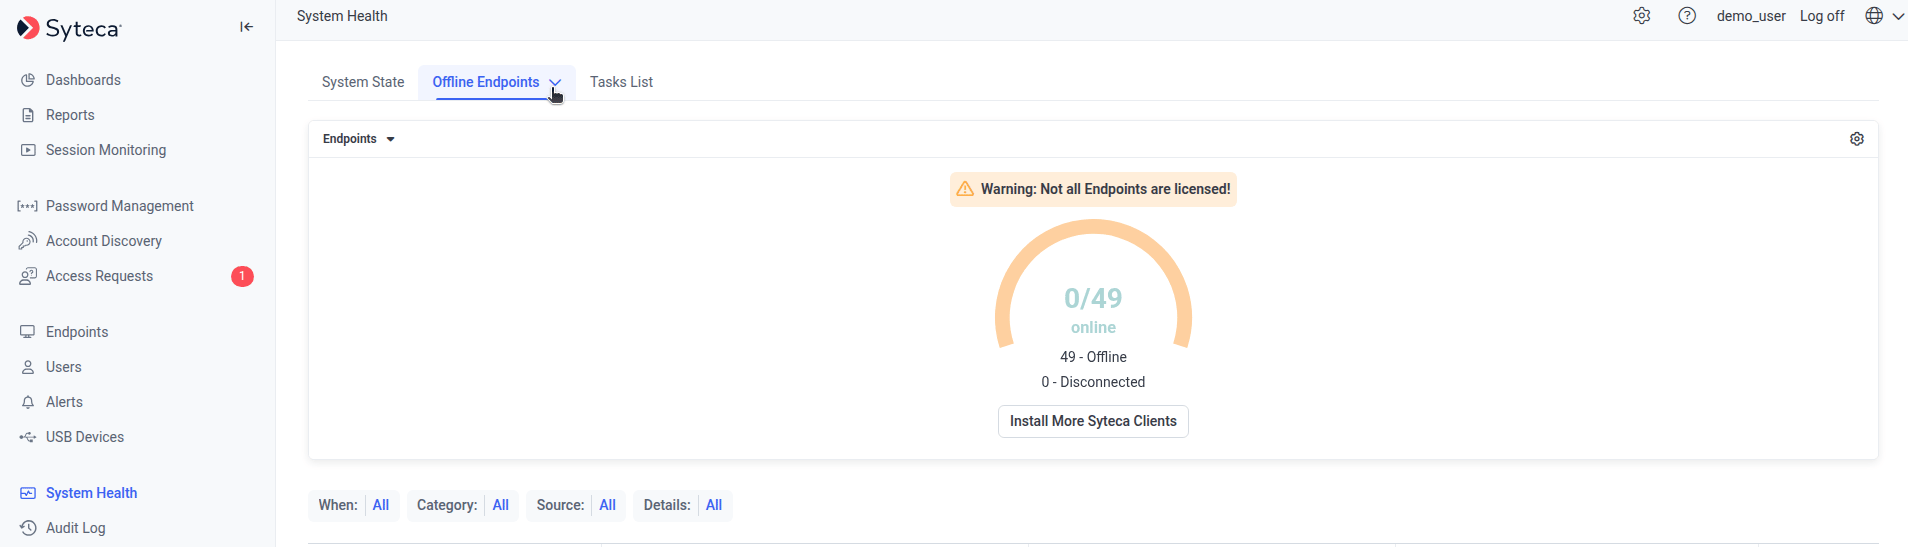
A pie chart of the number of Clients currently **Online**, **Offline**, and [**Disconnected**](/docs/administration/clients/parameters/disconnected-client-detection) - where Disconnected means a Client that's been offline longer than its specified threshold. Updates every **1 minute**. An **Install More Clients** button links to the Computers Without Clients page.
| Setting | What it controls |
| ------------------------------------- | --------------------------------- |
| **Online Clients sector color** | Color of the Online sector. |
| **Offline Clients sector color** | Color of the Offline sector. |
| **Disconnected Clients sector color** | Color of the Disconnected sector. |
If at least one Client doesn't have a valid license, the message **ATTENTION: Not all Clients are licensed!** appears at the top of the dashboard.
**Requires** one of:
* [Client Installation and Management administrative permission](/docs/administration/users/administrative-permissions) - to view all Clients in the system.
* At least one [Client permission](/docs/administration/users/client-permissions) - to view only Clients you have permission for.
 ## Customize the layout and settings
| Action | How |
| ------------------------ | -------------------------------------------------------------------------------- |
| **Rearrange dashboards** | Drag the gray header of any dashboard to a new location. |
| **Resize a dashboard** | Drag a bottom corner of any dashboard. |
| **Configure settings** | Click the cog icon in the top right of any dashboard. |
| **Collapse / expand** | Click the collapse or expand icon at the top of any dashboard, next to its name. |
Customizations are user-specific and stored on the Application Server, so they follow you to other computers.
## View disconnected Clients
Clients that have been offline longer than a specified threshold appear on the **Offline Clients** tab of the **System Health** page, visible to users with the [administrative Client Installation and Management permission](/docs/administration/users/administrative-permissions).
In Multi-Tenant mode, tenant users only see Clients belonging to their own tenant.
The grid shows:
| Column | Contents |
| -------------- | ------------------------------------------------------------------ |
| **Date** | When the Client was detected as disconnected, or came back online. |
| **Category** | The Client's online/offline status. |
| **Source** | The Client's name. |
| **Details** | The time it was detected disconnected, or the time it reconnected. |
| **Remove All** | Delete the recorded information about the Client. |
Filter by **When** (a preset or custom time range), **Category**, **Source**, or **Details**. Click a column header to sort, and use **Offline Clients → Export Filtered Records** to export the current view.
## Customize the layout and settings
| Action | How |
| ------------------------ | -------------------------------------------------------------------------------- |
| **Rearrange dashboards** | Drag the gray header of any dashboard to a new location. |
| **Resize a dashboard** | Drag a bottom corner of any dashboard. |
| **Configure settings** | Click the cog icon in the top right of any dashboard. |
| **Collapse / expand** | Click the collapse or expand icon at the top of any dashboard, next to its name. |
Customizations are user-specific and stored on the Application Server, so they follow you to other computers.
## View disconnected Clients
Clients that have been offline longer than a specified threshold appear on the **Offline Clients** tab of the **System Health** page, visible to users with the [administrative Client Installation and Management permission](/docs/administration/users/administrative-permissions).
In Multi-Tenant mode, tenant users only see Clients belonging to their own tenant.
The grid shows:
| Column | Contents |
| -------------- | ------------------------------------------------------------------ |
| **Date** | When the Client was detected as disconnected, or came back online. |
| **Category** | The Client's online/offline status. |
| **Source** | The Client's name. |
| **Details** | The time it was detected disconnected, or the time it reconnected. |
| **Remove All** | Delete the recorded information about the Client. |
Filter by **When** (a preset or custom time range), **Category**, **Source**, or **Details**. Click a column header to sort, and use **Offline Clients → Export Filtered Records** to export the current view.
 The [System Health dashboards](/docs/administration/dashboards/system-health-dashboards) also summarize how many Clients are currently online, offline, and disconnected at a glance.
## View system errors and warnings
**NOT AVAILABLE IN SAAS.**
**The critical error threshold.** If errors exceed 100 per minute, Transaction Log recording stops and a **Critical Error Threshold** error is logged instead - usually a sign that Clients are failing to write data to the database. Logging resumes once the error rate drops back below 100 per minute.
## Tasks List
The **Tasks List** tab shows long-running background tasks, and lets you cancel them.
In Multi-Tenant mode, users see only their own tenant's tasks. Viewing requires the [administrative Client Installation and Management permission](/docs/administration/users/administrative-permissions); canceling additionally requires the administrative Database Management permission.
Task types shown:
| Task type | Added to the grid when |
| ---------------------------------------------- | ---------------------------------------------------------------------------------------------------------- |
| **Scheduled (Archive &) Cleanup** | A scheduled Cleanup or Archive & Cleanup runs - one task per 10 Client sessions processed. |
| **Manual (Archive &) Cleanup** | A one-time Cleanup or Archive & Cleanup runs via **Run once** - one task per 10 Client sessions processed. |
| **Scheduled report generation** | A Scheduled Report rule triggers - one task per Report Type in the rule. |
| **Manual report generation** | A report is generated via **Generate Report** on the Report Generator tab. |
| **Updating the Blocked Users list** | Users are added to or removed from the Blocked Users list. |
| **Forensic Export** | A Forensic Export runs - one task per Client session (or session fragment) exported. |
| **Account Discovery** / **Account Onboarding** | An [Account Discovery rule](/docs/pam/discovery/overview) runs, manually or on schedule. |
Each row shows:
| Column | Contents |
| --------------- | ----------------------------------------------------------------------------------------------------------------------------------------------------------------------------------------------------------------------------------------------------------------------------------------------------------------- |
| **Start Time** | When the task began executing (after queuing). |
| **Task Name** | Depends on task type - for example "Sessions Archiving and Cleanup," the Report Type name, "Updating Blocked Users list," "Forensic Export," "Account Discovery," or "Account Onboarding." |
| **Node** | The computer processing the task. |
| **Details** | Task-specific context - affected sessions, tenant, Client groups, or Clients for cleanup tasks; report period and tenant for report tasks; discovery rule type, domain, or IP range for Account Discovery tasks; error messages for failed Account Onboarding tasks. Click **"..."** to expand truncated details. |
| **Queued Time** | Total time spent waiting before execution started. |
| **Duration** | Total execution time. |
| **Status** | **Queued**, **In Progress**, **Finished**, **Failed**, or **Canceled**. |
Depending on status, action icons appear:
* **Cancel** - available for **Queued** (removes the task entirely) or **In Progress** (marks it **Canceled**) tasks.
* **Download logs** - Account Discovery tasks only, once **Finished** or **Failed**.
* **Remove** - Account Discovery tasks only, once **Finished** or **Failed**; deletes the task and its logs.
Select multiple tasks' checkboxes and use the **Bulk Action** button to cancel or remove several at once.
The [System Health dashboards](/docs/administration/dashboards/system-health-dashboards) also summarize how many Clients are currently online, offline, and disconnected at a glance.
## View system errors and warnings
**NOT AVAILABLE IN SAAS.**
**The critical error threshold.** If errors exceed 100 per minute, Transaction Log recording stops and a **Critical Error Threshold** error is logged instead - usually a sign that Clients are failing to write data to the database. Logging resumes once the error rate drops back below 100 per minute.
## Tasks List
The **Tasks List** tab shows long-running background tasks, and lets you cancel them.
In Multi-Tenant mode, users see only their own tenant's tasks. Viewing requires the [administrative Client Installation and Management permission](/docs/administration/users/administrative-permissions); canceling additionally requires the administrative Database Management permission.
Task types shown:
| Task type | Added to the grid when |
| ---------------------------------------------- | ---------------------------------------------------------------------------------------------------------- |
| **Scheduled (Archive &) Cleanup** | A scheduled Cleanup or Archive & Cleanup runs - one task per 10 Client sessions processed. |
| **Manual (Archive &) Cleanup** | A one-time Cleanup or Archive & Cleanup runs via **Run once** - one task per 10 Client sessions processed. |
| **Scheduled report generation** | A Scheduled Report rule triggers - one task per Report Type in the rule. |
| **Manual report generation** | A report is generated via **Generate Report** on the Report Generator tab. |
| **Updating the Blocked Users list** | Users are added to or removed from the Blocked Users list. |
| **Forensic Export** | A Forensic Export runs - one task per Client session (or session fragment) exported. |
| **Account Discovery** / **Account Onboarding** | An [Account Discovery rule](/docs/pam/discovery/overview) runs, manually or on schedule. |
Each row shows:
| Column | Contents |
| --------------- | ----------------------------------------------------------------------------------------------------------------------------------------------------------------------------------------------------------------------------------------------------------------------------------------------------------------- |
| **Start Time** | When the task began executing (after queuing). |
| **Task Name** | Depends on task type - for example "Sessions Archiving and Cleanup," the Report Type name, "Updating Blocked Users list," "Forensic Export," "Account Discovery," or "Account Onboarding." |
| **Node** | The computer processing the task. |
| **Details** | Task-specific context - affected sessions, tenant, Client groups, or Clients for cleanup tasks; report period and tenant for report tasks; discovery rule type, domain, or IP range for Account Discovery tasks; error messages for failed Account Onboarding tasks. Click **"..."** to expand truncated details. |
| **Queued Time** | Total time spent waiting before execution started. |
| **Duration** | Total execution time. |
| **Status** | **Queued**, **In Progress**, **Finished**, **Failed**, or **Canceled**. |
Depending on status, action icons appear:
* **Cancel** - available for **Queued** (removes the task entirely) or **In Progress** (marks it **Canceled**) tasks.
* **Download logs** - Account Discovery tasks only, once **Finished** or **Failed**.
* **Remove** - Account Discovery tasks only, once **Finished** or **Failed**; deletes the task and its logs.
Select multiple tasks' checkboxes and use the **Bulk Action** button to cancel or remove several at once.
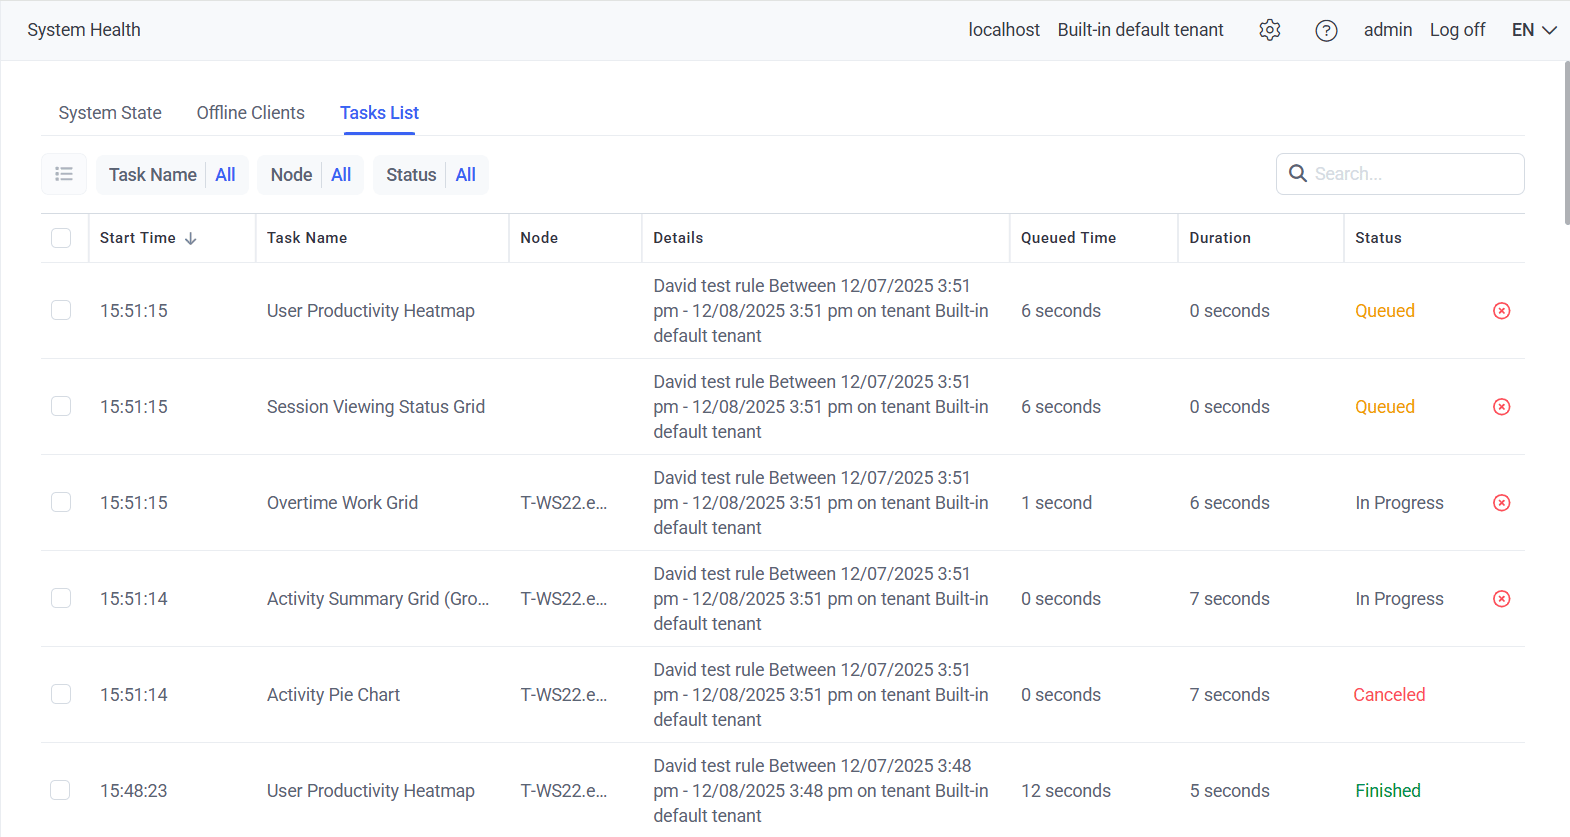 The grid refreshes automatically every 60 seconds (or press **F5** to refresh manually). Resize columns by dragging their separators. Sort by clicking a column header. Filter using the available filter controls, and search **Details** text using the Search box (top right). Click **Load More** to display 50 additional records at a time.
The **System State** tab shows system error and warning notifications in the **Transaction Log** grid, visible to users with the administrative Tenant Management and System Configuration permission.
Transaction Log records are kept for 30 days by default. Change this by adding the `HealthMonitoringCleanPeriod` key (value in days) to `EkranServer.Settings.config`, located by default in `C:\Program Files\Ekran System\Ekran System\Server`. The same file's `DatabaseStorageSizePerClientWarning` key controls the [free-space warning frequency](/docs/resources/troubleshooting/management-tool-troubleshooting#fix-the-running-out-of-free-space-warning).
**IN SAAS ONLY:** contact your Syteca vendor or the Syteca Support team to change the default 30-day retention.
The Transaction Log grid shows, most recent first:
| Column | Contents |
| -------------- | --------------------------------------------------------------------------------------------------------------------------------------------------------------------------------- |
| **Date** | Time of the event - or of its most recent occurrence, if repeated. |
| **Category** | The event's category. |
| **Source** | Where it occurred (Application Server, database, and so on). |
| **Details** | A description of the event. |
| **Severity** | **None**, **Medium**, or **Critical**. |
| **Count** | How many times the same event occurred within an hour - identical events within that window are grouped into one row, with a new row added each additional hour the event recurs. |
| **Remove All** | Delete one event record, or every record. |
Resize or hide columns via **Manage Hidden Columns**. Filter by **When**, **Category**, **Source**, and - via **More Criteria** - **Details** and **Severity**. Sort by clicking a column header. Export the current view via **System State → Export Filtered Records**.
For log downloads, see [Logs](/docs/resources/troubleshooting/logs#application-server-logs). To temporarily disconnect all Clients from the database during maintenance, see [Isolating the database from Clients](/docs/administration/deployment/database-management#isolate-the-database-from-clients).
## Related
Productivity, applications, websites, alerts, and sessions - a different page for a different audience.
The full System State view with error events and warnings.
Tamper-evident record of Management Tool activity.
The permissions each dashboard requires.
The grid refreshes automatically every 60 seconds (or press **F5** to refresh manually). Resize columns by dragging their separators. Sort by clicking a column header. Filter using the available filter controls, and search **Details** text using the Search box (top right). Click **Load More** to display 50 additional records at a time.
The **System State** tab shows system error and warning notifications in the **Transaction Log** grid, visible to users with the administrative Tenant Management and System Configuration permission.
Transaction Log records are kept for 30 days by default. Change this by adding the `HealthMonitoringCleanPeriod` key (value in days) to `EkranServer.Settings.config`, located by default in `C:\Program Files\Ekran System\Ekran System\Server`. The same file's `DatabaseStorageSizePerClientWarning` key controls the [free-space warning frequency](/docs/resources/troubleshooting/management-tool-troubleshooting#fix-the-running-out-of-free-space-warning).
**IN SAAS ONLY:** contact your Syteca vendor or the Syteca Support team to change the default 30-day retention.
The Transaction Log grid shows, most recent first:
| Column | Contents |
| -------------- | --------------------------------------------------------------------------------------------------------------------------------------------------------------------------------- |
| **Date** | Time of the event - or of its most recent occurrence, if repeated. |
| **Category** | The event's category. |
| **Source** | Where it occurred (Application Server, database, and so on). |
| **Details** | A description of the event. |
| **Severity** | **None**, **Medium**, or **Critical**. |
| **Count** | How many times the same event occurred within an hour - identical events within that window are grouped into one row, with a new row added each additional hour the event recurs. |
| **Remove All** | Delete one event record, or every record. |
Resize or hide columns via **Manage Hidden Columns**. Filter by **When**, **Category**, **Source**, and - via **More Criteria** - **Details** and **Severity**. Sort by clicking a column header. Export the current view via **System State → Export Filtered Records**.
For log downloads, see [Logs](/docs/resources/troubleshooting/logs#application-server-logs). To temporarily disconnect all Clients from the database during maintenance, see [Isolating the database from Clients](/docs/administration/deployment/database-management#isolate-the-database-from-clients).
## Related
Productivity, applications, websites, alerts, and sessions - a different page for a different audience.
The full System State view with error events and warnings.
Tamper-evident record of Management Tool activity.
The permissions each dashboard requires.