> ## Documentation Index
> Fetch the complete documentation index at: https://syteca.com/docs/llms.txt
> Use this file to discover all available pages before exploring further.
# Syteca Architecture
> The Syteca deployment architecture — Application Server, Management Tool, Clients (Windows / macOS / Linux), Master Panel, and SDK — with the basic deployment scheme and large-scale-deployment patterns for HA, multi-tenant, and global organizations.
## A few moving parts, deliberately
Most PAM/UAM platforms expose a sprawl of components: separate vault servers, password managers, web access proxies, recording engines, search indexers, reporting databases. Each component runs on its own host, with its own version, its own backup, its own failure mode. The operational surface grows fast — by mid-deployment, a typical cybersecurity installation has six to ten distinct services to maintain.
Syteca takes a different approach: **three main components** (Application Server, Management Tool, Clients) and **two optional standalone components** (Master Panel for large-scale aggregation, SDK for integrations). Everything else — session recording, alert evaluation, password management, account discovery, USB monitoring, reporting, dashboards — lives inside those three main components, not as separate services. Less to install, less to update, less to back up, fewer cross-service version-compatibility issues during upgrades.
## Main system components
### Syteca Application Server
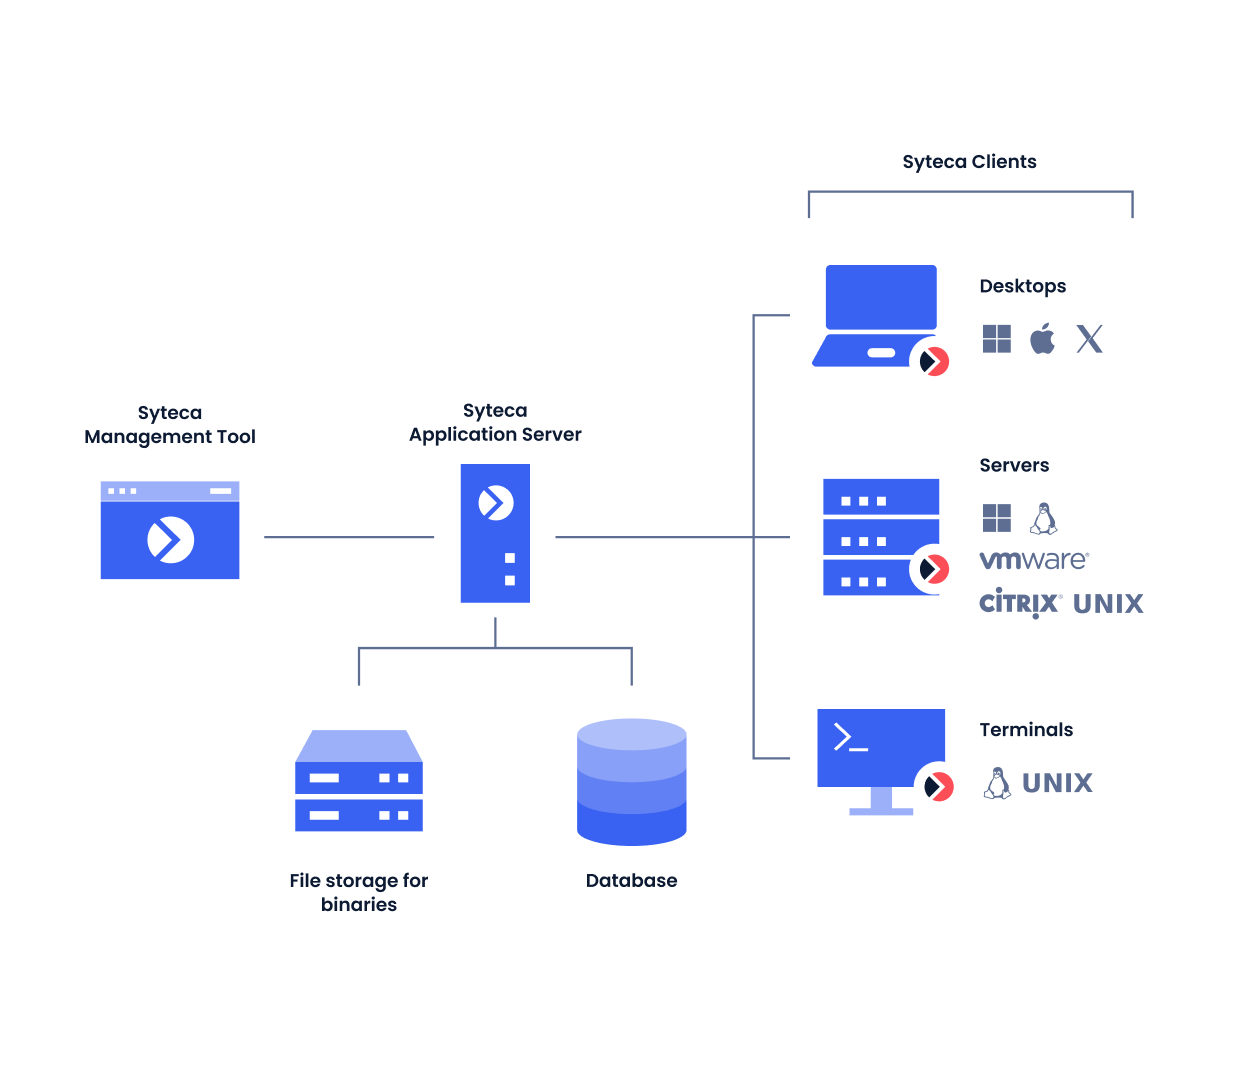
The Application Server is the central service every Client connects to and every Management Tool reads from. It:
* **Receives monitored data** (screen captures, metadata) from Syteca Clients.
* **Analyzes the data** in real time and **generates alerts** for potential security incidents.
* **Stores everything** in a central database (MS SQL Server or PostgreSQL — see [Comparison of database types](/docs/administration/database/compare-databases)).
* **Stores configuration data** for the deployment.
* **Sends update packages** to Clients when newer versions are released.
* **Performs database cleanup** and **creates reports** with statistics.
The Application Server runs as a Windows service (`EkranServer`). Its operation is controlled via the **Syteca Server tray icon** in the Windows Notification area, which also exposes the **Database Parameters** (`DbSetupToolUI`) application for [reissuing the Master Certificate](/docs/administration/security/master-certificate#reissue-the-master-certificate), editing database parameters, and similar operations.
**NOT AVAILABLE IN SAAS.** In SaaS deployments, the Application Server is hosted and managed by your Syteca vendor — customers don't install or maintain it directly.
### Syteca Management Tool
The Management Tool is the **web-based administrative console** — accessed remotely from any browser in the network without needing local installation. Through it, administrators:
* View and analyze monitored security data from Clients.
* Manage Clients, users, USB monitoring rules, alerts, and the database.
* Activate and manage serial keys and licenses.
* Access the **[Session Viewer](/docs/session-monitoring/player/overview)** to play back recorded sessions, with synchronized screen captures and metadata side by side.
### Syteca Clients
Clients are lightweight agents installed on monitored endpoints. Three OS families are supported, each with its own configuration page:
| Client | Records | Configuration |
| ------------------------------------------------------ | ----------------------------------------------------------------------------------------------------------------------------------------------------------------------------- | ---------------------------- |
| **[Windows Clients](/docs/administration/clients/windows)** | Screen captures with mouse movements (video), plus metadata: usernames, host names, activity times, active window titles, application names, URLs, clipboard text, keystrokes | Windows Client configuration |
| **[macOS Clients](/docs/administration/clients/macos)** | Screen captures with mouse movements, plus usernames, host names, activity times, active window titles, application names | macOS Client configuration |
| **[Linux Clients](/docs/administration/clients/linux)** | Screen captures *(for X Window System GUI)* + terminal input/output (commands executed, command output) for SSH and local terminal sessions | Linux Client configuration |
All Client configuration is performed centrally through the Management Tool — there's no per-endpoint configuration to maintain.
## Other system components
### Syteca Master Panel
The Master Panel is an **additional standalone component** used in large-scale deployments with High Availability mode across multiple Application Server instances. It combines data from every Application Server in the deployment so administrators can view all Client sessions through a single user interface — without switching between separate Application Server consoles.
For deployment details, see [Master Panel changelog](/docs/release-notes/components/master-panel) and the [High Availability](/docs/administration/deployment/high-availability) page.
**NOT AVAILABLE IN SAAS.** The Master Panel is used to aggregate multiple on-premises Application Servers and is not relevant to SaaS deployments.
### Syteca SDK
The Syteca **Software Development Kit** is for developers integrating Syteca with custom information systems — Business Intelligence platforms, custom dashboards, security automation tools. The SDK consists of APIs and tools to facilitate data transfer between Syteca and external systems.
For commercial integrations using documented APIs, see also the [Syteca API Data Connector](/docs/release-notes/components/data-connector) and the [Application Credentials Broker (ACB)](/docs/api/acb/overview).
## The basic deployment scheme
Maximum visibility and control comes from installing the right Client type on every endpoint to be monitored — Windows Clients on Windows desktops and servers, macOS Clients on Macs, Linux Clients on Linux workstations and servers. All Clients connect to the same Application Server, which stores their data in the same database and serves the same Management Tool.
 ## Where Clients can be deployed
A Syteca Client can run on any standard Windows, macOS, or Linux machine — but the deployment context determines what you'll see in the Session Viewer:
| Deployment type | What Syteca records |
| -------------------------- | ------------------------------------------------------------------------------------------------------------------------------------------------------------------------------------------------------------ |
| **Infrastructure servers** | Activity by administrators connecting to manage the server. |
| **Terminal servers** | Every user session on the terminal server — useful for monitoring contractor pools, BPO operations, or shared-access machines. **One Client license** covers all concurrent sessions on the terminal server. |
| **Jump servers** | Administrative access flowing through the jump server, including (when paired with [PAM secrets](/docs/pam/secrets/view-manage-secrets)) the privileged credentials being used. |
| **Physical desktops** | Standard user activity on dedicated workstations. |
| **Virtual desktops (VDI)** | Standard user activity on virtual desktops — see [VDI monitoring](/docs/administration/deployment/vdi-monitoring) for the supported VDI platforms and the floating-licensing model. |
Across all of these, the Client captures users' screens with mouse movements according to the recording settings, and logs metadata (application names, window titles, keystrokes, etc.) alongside the visual capture. **If network connectivity to the Application Server is lost, the Client temporarily caches data in protected local storage until the connection is restored** — no data is lost during transient outages.
The Client can be tuned anywhere from heavy recording (screen capture every second, or per mouse click / key press) down to lightweight recording (event-based only). **Protected mode** can also be enabled to harden Client operation against tampering.
## Large-scale deployment patterns
For organizations with data centers in multiple geographies, large concurrent-session counts, or strict data isolation requirements, three deployment patterns combine to scale Syteca beyond a single-Application-Server topology:
| Pattern | When you need it |
| -------------------------------------------------------------------------- | ------------------------------------------------------------------------------------------------------------------------------------------------------------------------------------------------------------------------------------------------------------------------------------------------------------------- |
| **[High Availability mode](/docs/administration/deployment/high-availability)** | 1,000+ concurrent Client sessions, or any deployment where Application Server downtime is unacceptable. Multiple Application Servers behind a load balancer in a Microsoft failover cluster, with optional [disaster recovery](/docs/administration/deployment/high-availability#disaster-recovery) via Storage Replica. |
| **[Multi-Tenant mode](/docs/administration/multi-tenant/overview)** | MSSP customers managing many organizations' security in one Syteca instance; large enterprises with strict business-unit segregation. Each tenant's data is completely independent and not visible to other tenants. |
| **Master Panel** | View all Client sessions across multiple Application Server instances through a single interface — useful for geographically-distributed deployments where each region runs its own Application Server. See [Master Panel](/docs/release-notes/components/master-panel). |
For the supported VDI platforms and the floating-licensing model that makes VDI cost-effective, see [VDI monitoring](/docs/administration/deployment/vdi-monitoring).
## Related
Hardware, software, and network requirements for each deployment size.
Fresh installation including database, Master Certificate, and firewall.
Scale-out with multiple Application Servers and load balancing.
Citrix, VMware Horizon, Microsoft AVD, Amazon WorkSpaces.
## Where Clients can be deployed
A Syteca Client can run on any standard Windows, macOS, or Linux machine — but the deployment context determines what you'll see in the Session Viewer:
| Deployment type | What Syteca records |
| -------------------------- | ------------------------------------------------------------------------------------------------------------------------------------------------------------------------------------------------------------ |
| **Infrastructure servers** | Activity by administrators connecting to manage the server. |
| **Terminal servers** | Every user session on the terminal server — useful for monitoring contractor pools, BPO operations, or shared-access machines. **One Client license** covers all concurrent sessions on the terminal server. |
| **Jump servers** | Administrative access flowing through the jump server, including (when paired with [PAM secrets](/docs/pam/secrets/view-manage-secrets)) the privileged credentials being used. |
| **Physical desktops** | Standard user activity on dedicated workstations. |
| **Virtual desktops (VDI)** | Standard user activity on virtual desktops — see [VDI monitoring](/docs/administration/deployment/vdi-monitoring) for the supported VDI platforms and the floating-licensing model. |
Across all of these, the Client captures users' screens with mouse movements according to the recording settings, and logs metadata (application names, window titles, keystrokes, etc.) alongside the visual capture. **If network connectivity to the Application Server is lost, the Client temporarily caches data in protected local storage until the connection is restored** — no data is lost during transient outages.
The Client can be tuned anywhere from heavy recording (screen capture every second, or per mouse click / key press) down to lightweight recording (event-based only). **Protected mode** can also be enabled to harden Client operation against tampering.
## Large-scale deployment patterns
For organizations with data centers in multiple geographies, large concurrent-session counts, or strict data isolation requirements, three deployment patterns combine to scale Syteca beyond a single-Application-Server topology:
| Pattern | When you need it |
| -------------------------------------------------------------------------- | ------------------------------------------------------------------------------------------------------------------------------------------------------------------------------------------------------------------------------------------------------------------------------------------------------------------- |
| **[High Availability mode](/docs/administration/deployment/high-availability)** | 1,000+ concurrent Client sessions, or any deployment where Application Server downtime is unacceptable. Multiple Application Servers behind a load balancer in a Microsoft failover cluster, with optional [disaster recovery](/docs/administration/deployment/high-availability#disaster-recovery) via Storage Replica. |
| **[Multi-Tenant mode](/docs/administration/multi-tenant/overview)** | MSSP customers managing many organizations' security in one Syteca instance; large enterprises with strict business-unit segregation. Each tenant's data is completely independent and not visible to other tenants. |
| **Master Panel** | View all Client sessions across multiple Application Server instances through a single interface — useful for geographically-distributed deployments where each region runs its own Application Server. See [Master Panel](/docs/release-notes/components/master-panel). |
For the supported VDI platforms and the floating-licensing model that makes VDI cost-effective, see [VDI monitoring](/docs/administration/deployment/vdi-monitoring).
## Related
Hardware, software, and network requirements for each deployment size.
Fresh installation including database, Master Certificate, and firewall.
Scale-out with multiple Application Servers and load balancing.
Citrix, VMware Horizon, Microsoft AVD, Amazon WorkSpaces.