> ## Documentation Index
> Fetch the complete documentation index at: https://syteca.com/docs/llms.txt
> Use this file to discover all available pages before exploring further.
# Power BI Example
> End-to-end use case — import Syteca monitoring data into Microsoft Power BI report templates using the Syteca API Data Connector. Includes example report views for idle time, productivity, and application usage.
This use case walks through importing Syteca monitoring data into Microsoft Power BI report templates using the Syteca API Data Connector. The result is a set of Power BI dashboards covering idle time, work time, user productivity, interactive monitoring, and application usage — driven by live API calls into the Data Connector.
**NOT AVAILABLE IN SAAS.** The Data Connector is on-premises only.
## Before you start
| Prerequisite | Where |
| ----------------------------------------------------------------------------- | -------------------------------------------------------------------------------------------------------------------------- |
| **Data Connector installed and registered** | [Install the Data Connector](/docs/api/data-connector/overview) → [Register in the Management Tool](/docs/api/data-connector/manage) |
| **Power BI Desktop** with your report template open | Power BI Desktop installation |
| **Network reachability** between Power BI Desktop and the Data Connector host | TCP/HTTPS to the configured hostname |
| **Active API key** from the Management Tool user that will run the reports | [Manage → Get an API key](/docs/api/data-connector/manage#get-an-api-key) |
## Import Syteca data into a Power BI report template
Open the required Syteca Power BI report template (`.pbit` or `.pbix` file) in **Power BI Desktop**.
Open the Syteca Management Tool. Click the button in the top right where your user name is displayed.
On the **Manage Account** page, click the **Copy** icon next to the **Active API Key** field to copy the key to your clipboard.
Treat the API key like a password — anyone with it can read every monitoring record visible to your user account. Don't paste it into shared chats or commit it to source control.
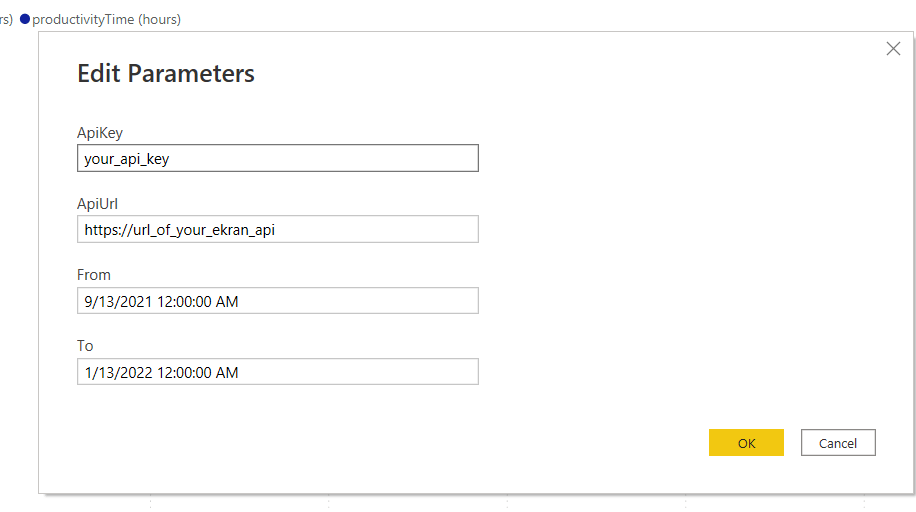
In the Power BI report template, click **Transform data → Edit parameters** to open the **Edit Parameters** dialog.
* **`ApiKey`** — paste the value you copied from the Management Tool.
* **`ApiUrl`** — set to the Data Connector URL in the form `https:///ekranapi` (where `` matches the **Issued To** field of the HTTPS certificate you set up during [installation](/docs/api/data-connector/install#3-set-up-an-https-certificate)).
Include the `/ekranapi` path suffix — without it, Power BI calls will return 404.
Change the **`From`** and **`To`** fields if you want to constrain the date range. These parameters drive the [User Productivity](/docs/api/data-connector/endpoints/get-user-productivity) dataset specifically — other datasets in the template may use their own ranges.
Click **OK** in the Edit Parameters dialog, then click **Apply changes** in the Power BI ribbon. Power BI calls each endpoint in turn and loads the data into the report's tables.
Wait until all data is imported — large date ranges or busy Syteca deployments may take a few minutes. The report visuals populate automatically once data load completes.
 ## Example reports
Power BI templates from Syteca typically include the following reports:
### Idle Time and Work Time
## Example reports
Power BI templates from Syteca typically include the following reports:
### Idle Time and Work Time
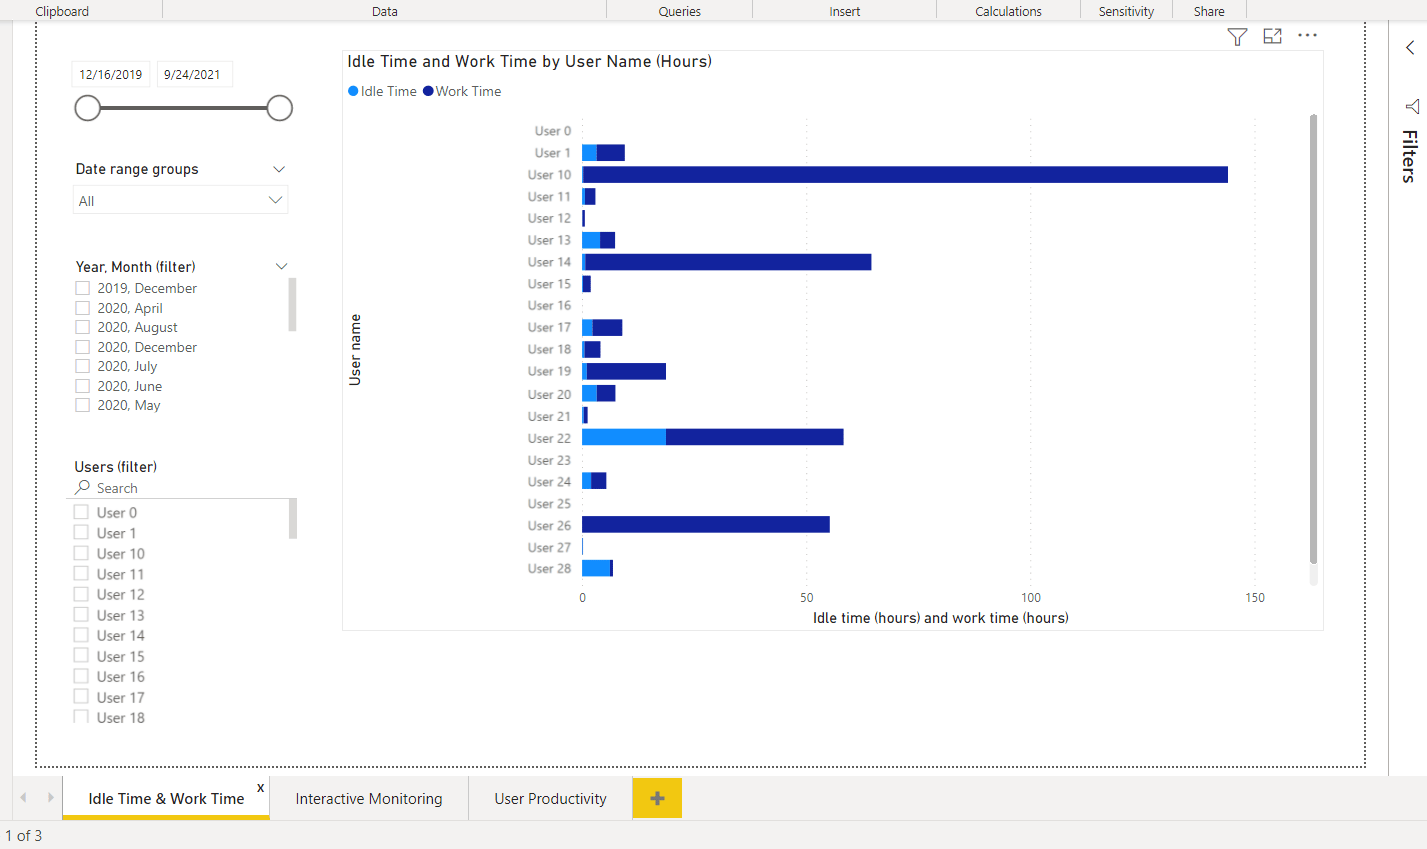 **Endpoints used:** [`POST /sessions`](/docs/api/data-connector/endpoints/post-sessions) (for `duration`, `idleTime`, `productivityTime` per session).
### Interactive Monitoring
A timeline-style view of user activity events, blended with alert events for context. Useful for incident review where you need to see "what was this user doing when the alert fired?"
**Endpoints used:** [`POST /sessions`](/docs/api/data-connector/endpoints/post-sessions) + [`GET /alerts`](/docs/api/data-connector/endpoints/get-alerts).
### User Productivity
**Endpoints used:** [`POST /sessions`](/docs/api/data-connector/endpoints/post-sessions) (for `duration`, `idleTime`, `productivityTime` per session).
### Interactive Monitoring
A timeline-style view of user activity events, blended with alert events for context. Useful for incident review where you need to see "what was this user doing when the alert fired?"
**Endpoints used:** [`POST /sessions`](/docs/api/data-connector/endpoints/post-sessions) + [`GET /alerts`](/docs/api/data-connector/endpoints/get-alerts).
### User Productivity
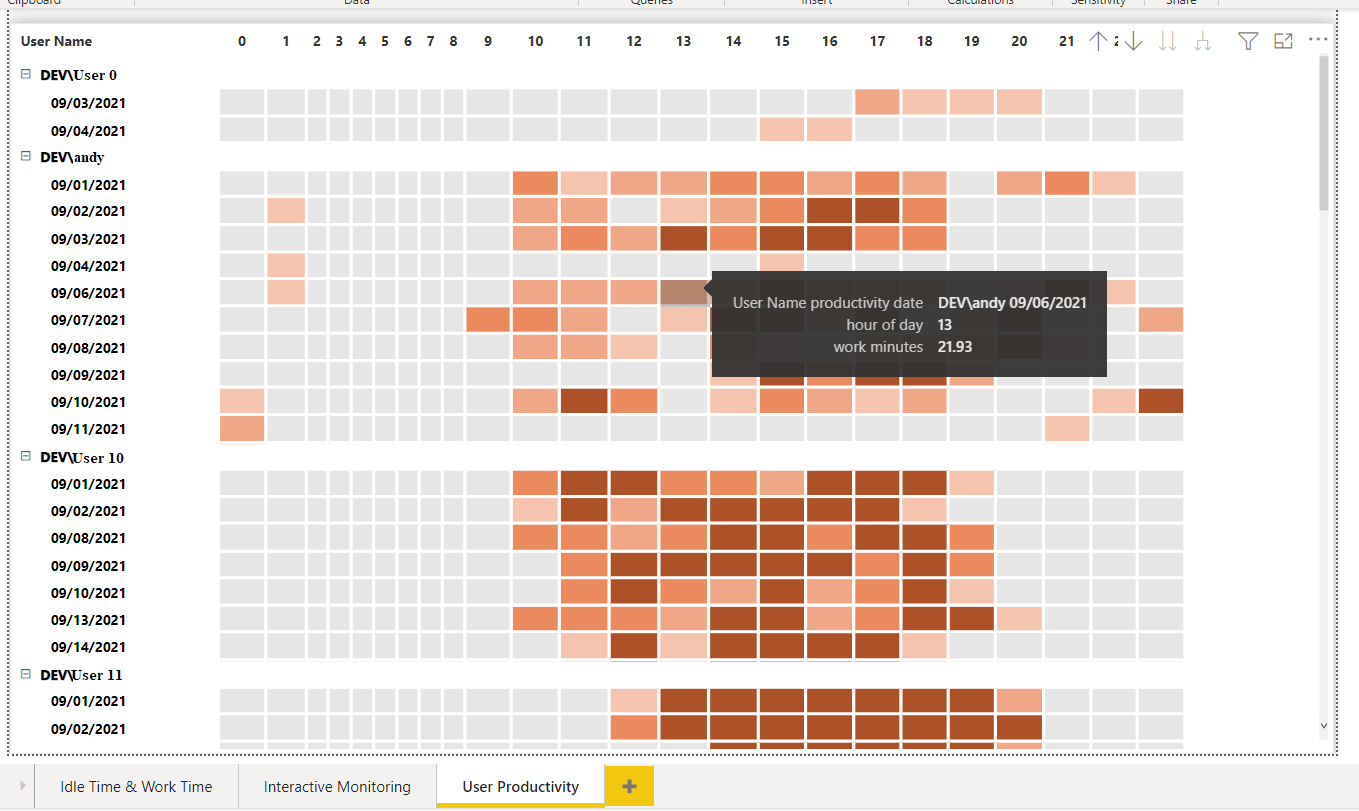 **Endpoints used:** [`GET /user/getproductivity`](/docs/api/data-connector/endpoints/get-user-productivity) (for the `(userName, timeOfDay, totalMinutes)` triples).
### Application Usage
**Endpoints used:** [`GET /user/getproductivity`](/docs/api/data-connector/endpoints/get-user-productivity) (for the `(userName, timeOfDay, totalMinutes)` triples).
### Application Usage
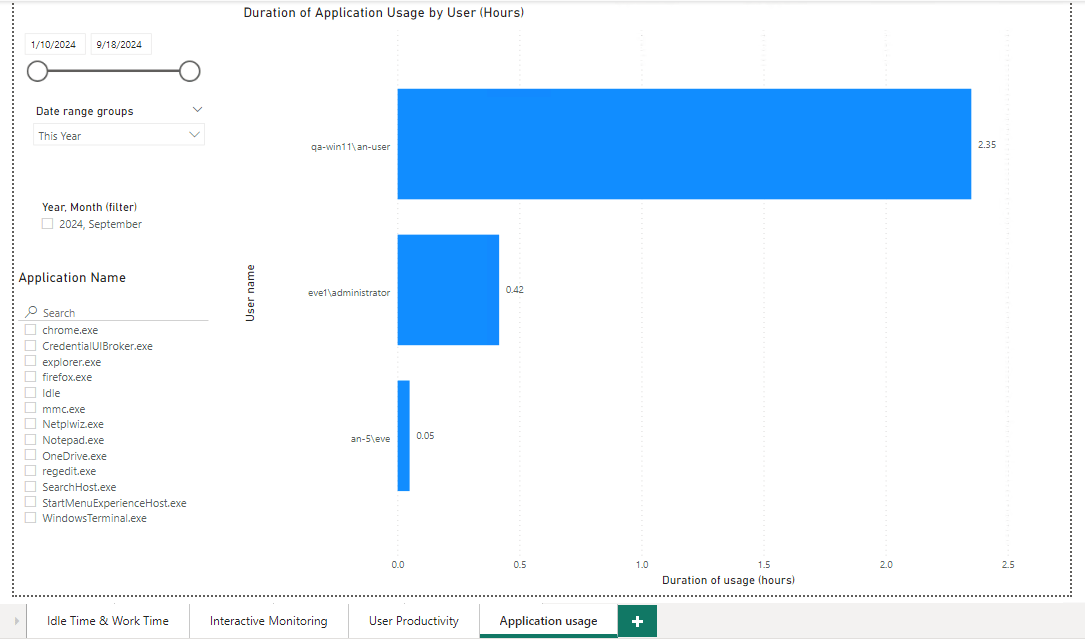 **Endpoints used:** [`GET /statistics/getapp`](/docs/api/data-connector/endpoints/get-application-statistics) (and optionally [`GET /statistics/geturl`](/docs/api/data-connector/endpoints/get-url-statistics) for a URL-equivalent report).
## Building your own Power BI reports
The reports above are starting templates — you can build any Power BI visualization that fits the API's data shape:
| You want to visualize | Endpoint to call |
| --------------------------------------------- | ------------------------------------------------------------------------------------------------------------- |
| Sessions per Client / per user / per day | [`POST /sessions`](/docs/api/data-connector/endpoints/post-sessions) |
| Active time per user, per hour of day | [`GET /user/getproductivity`](/docs/api/data-connector/endpoints/get-user-productivity) |
| Time spent in each application, per session | [`GET /statistics/getapp`](/docs/api/data-connector/endpoints/get-application-statistics) |
| Time spent on each website, per session | [`GET /statistics/geturl`](/docs/api/data-connector/endpoints/get-url-statistics) |
| Alert events with deep-link to Session Viewer | [`GET /alerts`](/docs/api/data-connector/endpoints/get-alerts) |
| Endpoint Access Control audit trail | [`GET /AccessRequests/GetEndpointAccessRequests`](/docs/api/data-connector/endpoints/get-endpoint-access-requests) |
In Power BI, use **Get data → Web** with the ApiUrl and the ApiKey header — Power BI handles the JSON parsing automatically, exposing the response fields as Power Query columns.
## Refreshing the data
Power BI reports built on the Data Connector follow Power BI's standard refresh model:
* **Manual refresh in Desktop**: click **Refresh** in the Home ribbon to re-call every endpoint and update visuals.
* **Scheduled refresh in the Power BI service**: publish the report to Power BI service and configure a scheduled refresh. The Data Connector must be reachable from the Power BI service host — for on-premises deployments, that typically means an **On-premises data gateway** between Power BI service and your network.
## Fix an SSL/TLS certificate error
**NOT AVAILABLE IN SAAS.**
If Power BI shows an SSL/TLS certificate error when connecting to the Data Connector, check the following:
In the Power BI report template, click **Transform data > Edit parameters**. If **ApiUrl** uses the machine's IP address, replace it with its hostname instead, for example `https:///ekranapi`.
The hostname in **ApiUrl** must exactly match the **Issued To** name on the [HTTPS certificate](/docs/api/data-connector/install#3-set-up-an-https-certificate) — not any other valid hostname for the machine.
Confirm the Management Tool machine has a valid SSL certificate, and that the same certificate is added to the Trusted Root Certificate store on the machine running Power BI Desktop.
In Power BI Desktop, go to **File > Options and settings > Options**:
* **Security** page — set **Certificate Revocation** to **None**, and **Data Extensions** to **Allow any extension to load without validation or warning**.
* **Privacy** page — set **Privacy Levels** to **Always ignore Privacy Level settings**.
## Related
Authentication, base URL, time conventions, all endpoints, status codes.
Prerequisites and MSI install before you can connect Power BI.
Get your API key from the Manage Account page.
Conceptual overview of the Data Connector and its use cases.
**Endpoints used:** [`GET /statistics/getapp`](/docs/api/data-connector/endpoints/get-application-statistics) (and optionally [`GET /statistics/geturl`](/docs/api/data-connector/endpoints/get-url-statistics) for a URL-equivalent report).
## Building your own Power BI reports
The reports above are starting templates — you can build any Power BI visualization that fits the API's data shape:
| You want to visualize | Endpoint to call |
| --------------------------------------------- | ------------------------------------------------------------------------------------------------------------- |
| Sessions per Client / per user / per day | [`POST /sessions`](/docs/api/data-connector/endpoints/post-sessions) |
| Active time per user, per hour of day | [`GET /user/getproductivity`](/docs/api/data-connector/endpoints/get-user-productivity) |
| Time spent in each application, per session | [`GET /statistics/getapp`](/docs/api/data-connector/endpoints/get-application-statistics) |
| Time spent on each website, per session | [`GET /statistics/geturl`](/docs/api/data-connector/endpoints/get-url-statistics) |
| Alert events with deep-link to Session Viewer | [`GET /alerts`](/docs/api/data-connector/endpoints/get-alerts) |
| Endpoint Access Control audit trail | [`GET /AccessRequests/GetEndpointAccessRequests`](/docs/api/data-connector/endpoints/get-endpoint-access-requests) |
In Power BI, use **Get data → Web** with the ApiUrl and the ApiKey header — Power BI handles the JSON parsing automatically, exposing the response fields as Power Query columns.
## Refreshing the data
Power BI reports built on the Data Connector follow Power BI's standard refresh model:
* **Manual refresh in Desktop**: click **Refresh** in the Home ribbon to re-call every endpoint and update visuals.
* **Scheduled refresh in the Power BI service**: publish the report to Power BI service and configure a scheduled refresh. The Data Connector must be reachable from the Power BI service host — for on-premises deployments, that typically means an **On-premises data gateway** between Power BI service and your network.
## Fix an SSL/TLS certificate error
**NOT AVAILABLE IN SAAS.**
If Power BI shows an SSL/TLS certificate error when connecting to the Data Connector, check the following:
In the Power BI report template, click **Transform data > Edit parameters**. If **ApiUrl** uses the machine's IP address, replace it with its hostname instead, for example `https:///ekranapi`.
The hostname in **ApiUrl** must exactly match the **Issued To** name on the [HTTPS certificate](/docs/api/data-connector/install#3-set-up-an-https-certificate) — not any other valid hostname for the machine.
Confirm the Management Tool machine has a valid SSL certificate, and that the same certificate is added to the Trusted Root Certificate store on the machine running Power BI Desktop.
In Power BI Desktop, go to **File > Options and settings > Options**:
* **Security** page — set **Certificate Revocation** to **None**, and **Data Extensions** to **Allow any extension to load without validation or warning**.
* **Privacy** page — set **Privacy Levels** to **Always ignore Privacy Level settings**.
## Related
Authentication, base URL, time conventions, all endpoints, status codes.
Prerequisites and MSI install before you can connect Power BI.
Get your API key from the Manage Account page.
Conceptual overview of the Data Connector and its use cases.