> ## Documentation Index
> Fetch the complete documentation index at: https://syteca.com/docs/llms.txt
> Use this file to discover all available pages before exploring further.
# Dashboard
> Monitor your endpoint security posture through widgets that highlight overall health, endpoint group health, active risk factors, policy check results, and the most critical endpoints.
The **Dashboard** page gives administrators a single place to monitor endpoint security posture through interactive charts and widgets. Gain visibility into overall health, endpoint group performance, active risk factors, policy health, and endpoints that require immediate attention.
Only endpoints for which the user has [Viewing Monitoring Results permission ](/docs/administration/users/client-permissions) and which have the corresponding license assigned are shown.
## Add, rearrange, resize, rename, and hide
Widgets on the Dashboard page can be rearranged to provide better data visibility and accessibility.
* **To add a widget**, click **Add widget** in the top right and pick a type.
* **To rename a widget**, click the **Edit** icon next to the widget name.
* **To resize a widget**, drag its border.
* **To rearrange widgets**, drag them via the top left corner to new locations.
* **To hide a widget**, click the **Close** icon in its top right.
You can restore the default layout anytime by clicking **Restore default view**.
Each user can rearrange widgets independently. Changes of one user does not affect others view.
## Available widgets
### System Security Posture
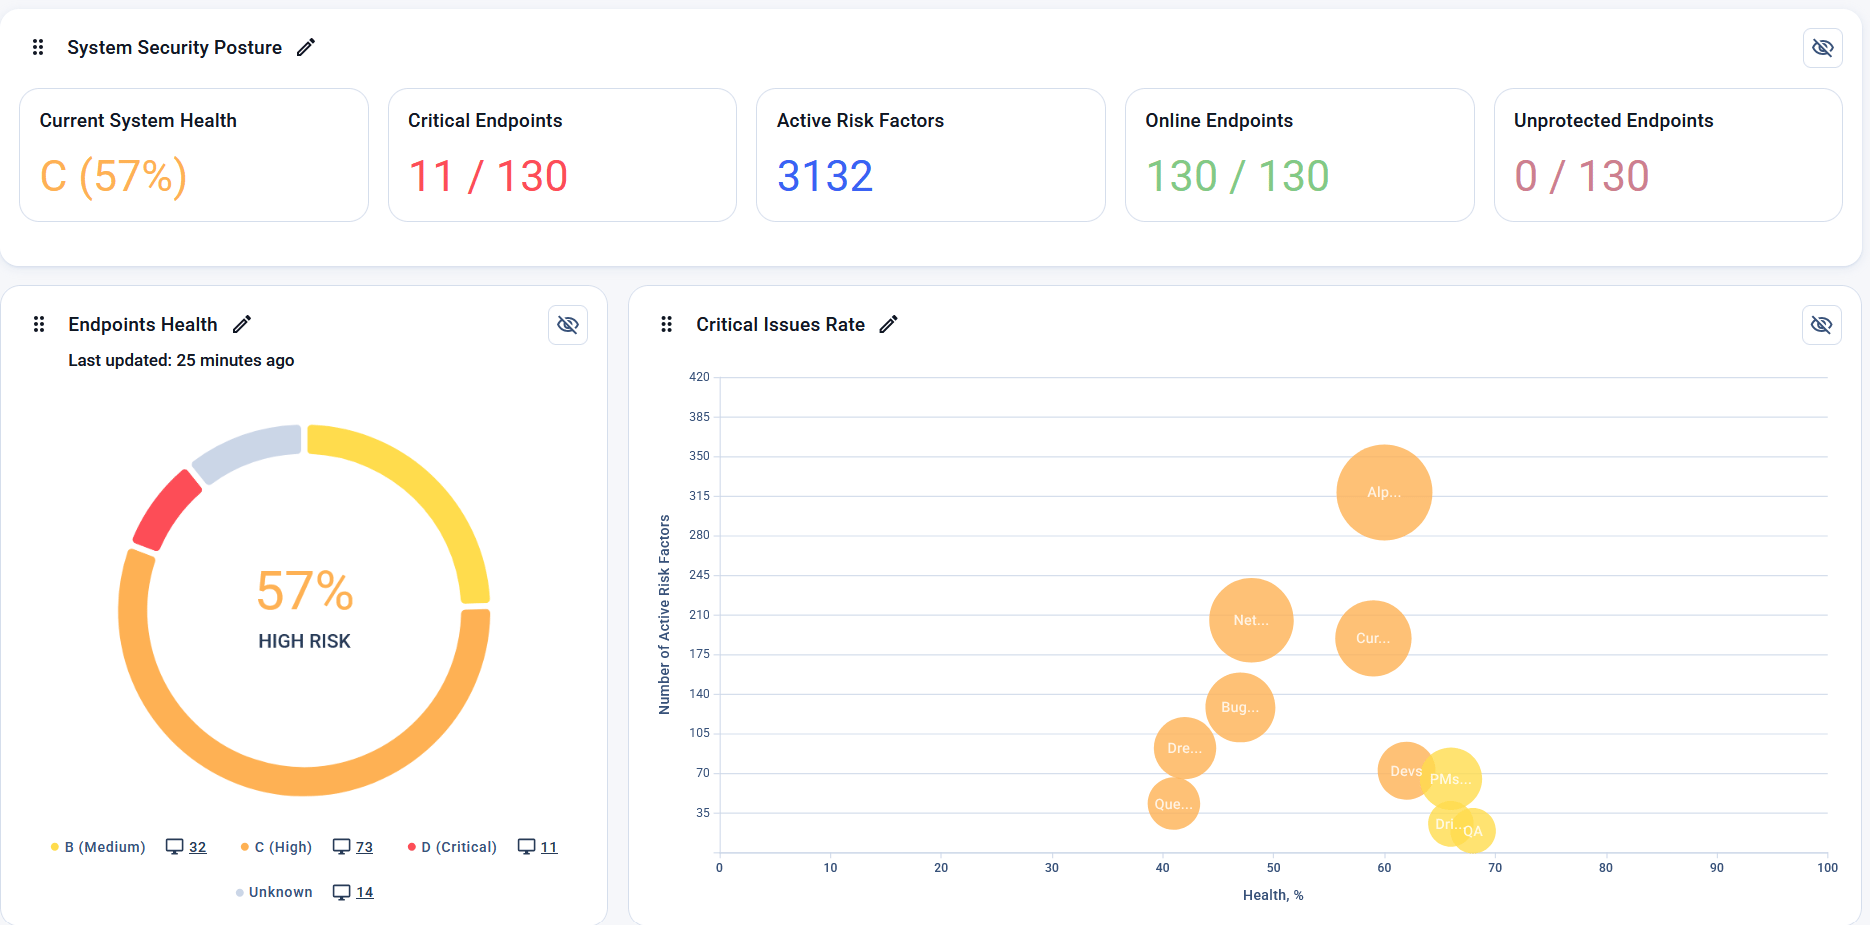
A collection of summary cards that provide a high-level overview of your endpoint security posture. Available cards include **Current System Health**, **Critical Endpoints**, **Actual Risk Factors**, **Online Endpoints**, and **Unprotected Endpoints** (the number of endpoints that do not have the ESPM license assigned and whose security posture is not monitored).
Each card displays key metrics across all endpoints available to the user. Clicking a card opens the corresponding page with relevant filters applied. For example, **Critical Endpoints** opens the Endpoints page filtered to show endpoints with critical health scores, while **Actual Risk Factors** opens the Risk Factors page displaying active risk factors.
### Current System Health
A doughnut chart showing the distribution of endpoint health across all available endpoints. The chart displays the current overall [health score](/docs/espm/endpoint-security-posture-and-health-score) and the number of endpoints within each [health level](/docs/espm/endpoint-security-posture-and-health-score#health-rating-scale).
Click a chart segment or its corresponding legend entry to open the [Endpoints page](/docs/espm/endpoints/endpoints-page) filtered by the selected health level. Hover over a segment to view the ESPM rating, health description, and number of represented endpoints.
### Critical Issues Rate
A bubble chart that visualizes the relationship between endpoint group health and active risk factors.
The number of endpoint groups displayed corresponds to the number of groups in Syteca.
The X-axis represents the endpoint group's **health**, while the Y-axis shows the **number of** [active ](/docs/espm/about-risk-factors#active)**risk factors** in it. The bubble size corresponds to the number of endpoints within the group, and bubble color reflects the health category. Click a bubble to open the Risk Factors page filtered for the selected endpoint group to see risk factors that need remediation for this group.
### Top 10 Lowest Health Endpoints
A horizontal bar chart displaying the endpoints with the lowest health scores.
Endpoints are ordered from lowest to highest health. If multiple endpoints have the same health value, those with more actual risk factors appear first. Bar colors correspond to health categories. Click a bar to open the [Endpoint details](/docs/espm/endpoints/endpoint-details) page for the selected endpoint.
### Risk Factors Summary
A list of policies or controls with health and risk information aggregated across available endpoints.
Switch between **Policies** and **Controls** views to analyze risk factors at different levels. Use the **Only policies/controls with active risk factors** switch to filter out policies/controls that currently do not have active risk factors in them and do not require immediate attention. Each entry displays the total number of risk factors, the number of affected endpoints, and the average health score. Click the risk factor count to view matching risk factors, or click the endpoint count to view affected endpoints.
 ## Related
Use dashboard widgets to compare security posture across endpoint groups, identify organizational security trends, and prioritize remediation efforts based on health scores, active risks, and policy compliance.
Identifying endpoints with critical health scores, reviewing the risk factors contributing to their condition, and accessing remediation guidance.
Health trends and actual risk factors on the individual endpoint dashboard.
Productivity, applications, websites, alerts, and sessions — a different page for a different audience.
## Related
Use dashboard widgets to compare security posture across endpoint groups, identify organizational security trends, and prioritize remediation efforts based on health scores, active risks, and policy compliance.
Identifying endpoints with critical health scores, reviewing the risk factors contributing to their condition, and accessing remediation guidance.
Health trends and actual risk factors on the individual endpoint dashboard.
Productivity, applications, websites, alerts, and sessions — a different page for a different audience.