> ## Documentation Index
> Fetch the complete documentation index at: https://syteca.com/docs/llms.txt
> Use this file to discover all available pages before exploring further.
# Endpoint details
> View the security health, risk exposure, and detailed configuration of an individual endpoint, including health trends, active risk factors, policy impacts, and key endpoint information.
The **Endpoint Details** page provides a comprehensive view of an individual endpoint's security posture, health status, and risk exposure. Use this page to monitor endpoint health trends, review active and historical risk factors, investigate security issues, and access technical information about the endpoint from a single location.
The page combines dashboard widgets, risk factor analysis, and endpoint information to help administrators understand the current state of an endpoint, identify security concerns, and prioritize remediation efforts.
Viewing the Endpoint details page requires the [Viewing Monitoring Results administrative permission](/docs/administration/users/administrative-permissions), plus the [Viewing Monitoring Results Endpoint permission](/docs/administration/users/client-permissions) for the specific endpoint.
## Endpoint Status
The endpoint status (online, offline or not licensed) is displayed as an icon in the header of the **Endpoint details** page, near the endpoint name.
## Dashboard
Endpoint details contain two widgets.
### Risk Factors Summary
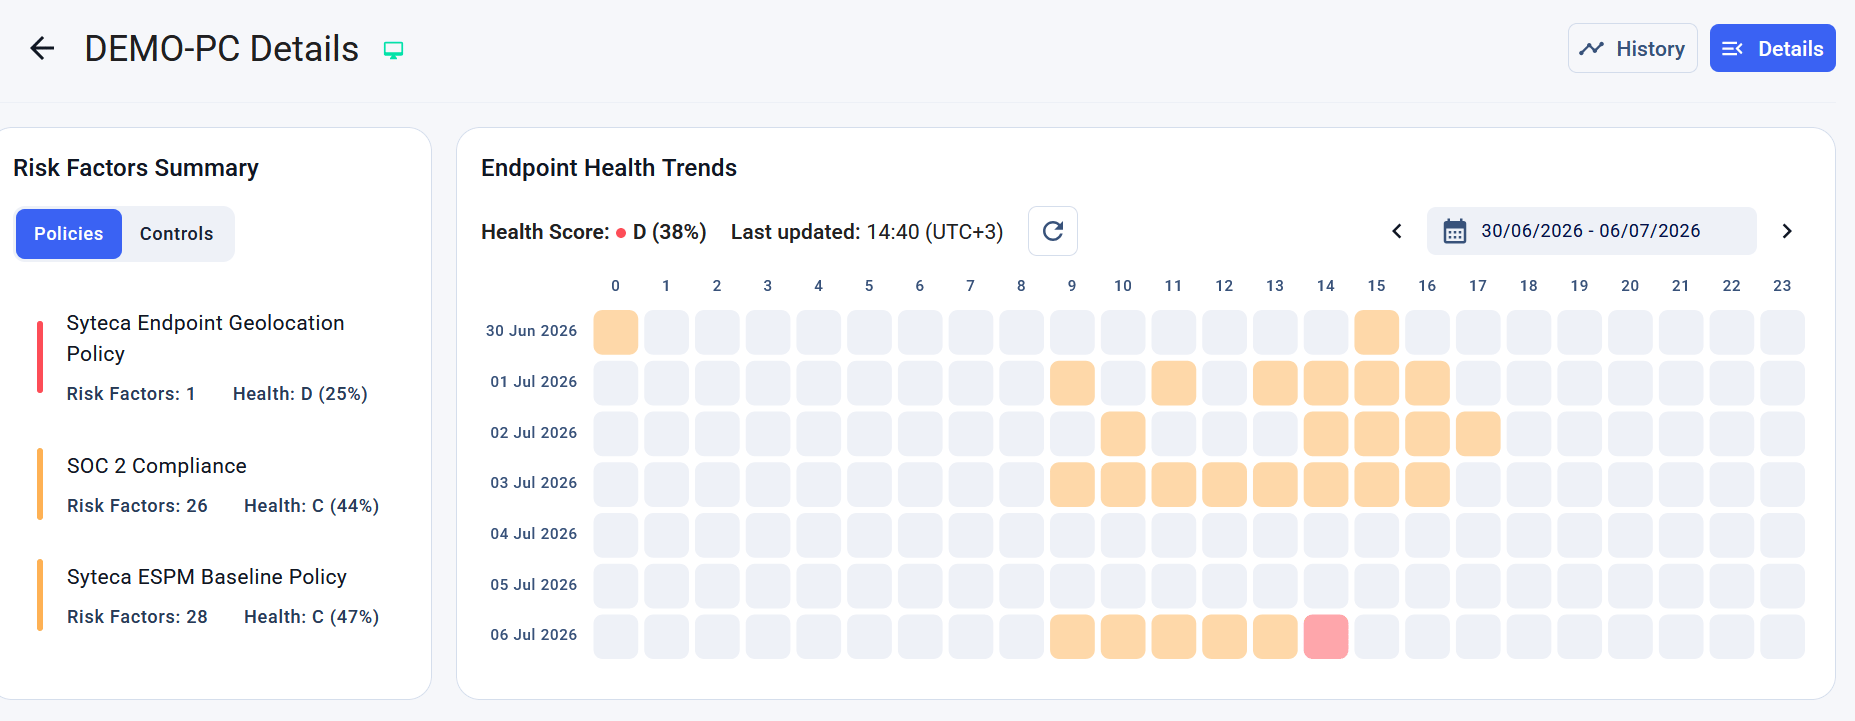
A list of [controls](/docs/espm/about-policies#controls) or [policies](/docs/espm/about-policies) associated with the selected endpoint displaying health and risk information for each item. Only policies or controls that contain at least one [active](/docs/espm/about-risk-factors#active) risk factor are displayed.
Switch between **Policies** and **Controls** views to analyze risk factors at different levels. Each entry displays the total number of active risk factors and the average health score for the selected policy or group. Entries are ordered by [health score](/docs/espm/endpoint-security-posture-and-health-score#endpoint-health-score) , from the lowest to the highest, with items that have an unknown health score listed last.
### Endpoint Health Trends
A heat map that visualizes changes in endpoint [health score](/docs/espm/endpoint-security-posture-and-health-score#endpoint-health-score) over time. Each row represents a day, and each column represents an hour. Cell colors indicate the lowest [health level](/docs/espm/endpoint-security-posture-and-health-score#health-rating-scale) detected during the corresponding hour, while gray cells indicate the endpoint was offline.
The widget header displays the current endpoint health score and the most recent update time. Use the date navigation controls to browse historical health data in 7-day intervals. The available history extends up to two years from the most recent health check.
Hover over any cell to view the health grade, health score, and the timestamp when the lowest health score was first detected during that hour.
 ## Risk Factors
The Risk factors grid contains the list of risk factors that were checked on the endpoint during the latest check, including their statuses and details.
### Risk Factors Grid
| Column | Shows |
| ------------------ | ------------------------------------------------------------------------------------------------------------------------------------------------------------------------------------------------------------ |
| **Risk Factor** | The name of the risk factor. Click it to open [Risk factor details](/docs/espm/riskfactors/risk-factors-details) including [remediation](/docs/espm/riskfactors/recommend-and-remedy) instructions. |
| **Control** | The list of the controls to which the risk factor belongs in the assigned policies. |
| **Risk Score** | The [risk level](/docs/espm/about-risk-factors#Risklevels) for the risk factor. If the risk factor belongs to several policies and has different severity in them, then the highest risk score will be displayed. |
| **Policy** | The policies containing the risk factor and assigned to the endpoint. Clicking a policy name opens the corresponding Policy page. |
| **First Detected** | The date and time when the risk factor was first detected as active on the endpoint. This value does not change even if the risk factor is remediated and later becomes active again. |
| **Last Detected** | The date and time when the risk factor was most recently detected as active. This typically matches the most recent scan time. |
| **Status** | The current [status](/docs/espm/about-risk-factors#risk-factor-statuses) of the risk factor on the endpoint: **Active**, **Not Applicable**, **No Evidence Found**, **Remediated**, or **No Longer Relevant**. |
### Grid Filters
By default, data in the grid is filtered by the Status column to display only Active risk factors. You can use other filters to find needed data. The filters include:
* Risk factor
* Control
* Policy
* Risk score by category (Critical, High, Medium, Low, or No Risk)
* Last detected date
* [Status](/docs/espm/about-risk-factors#risk-factor-statuses)
### Risk Factor Details
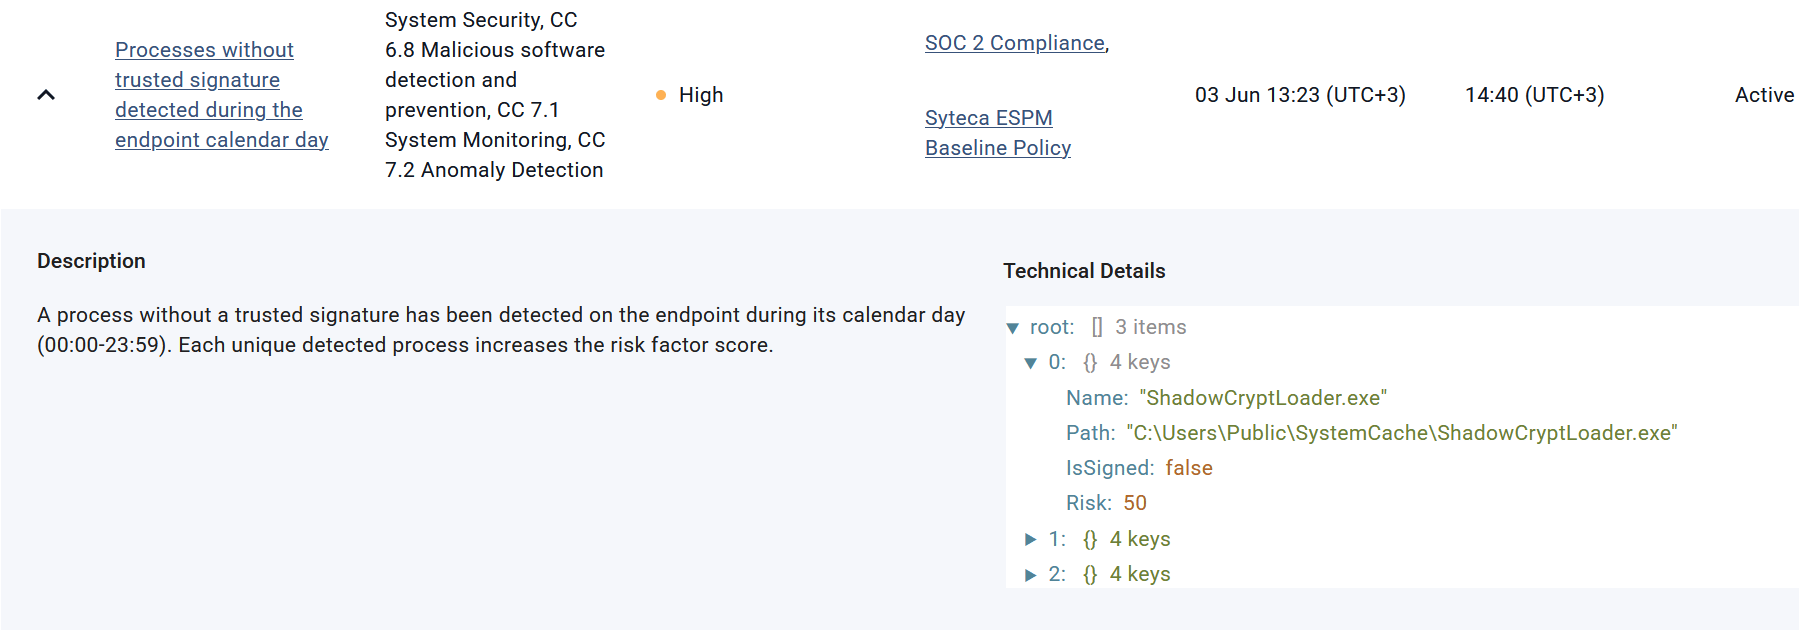
Expand a risk factor to view additional information about it. This is especially important for the active risk factors for understanding why it is considered a risk and what is to be remediated. The details panel provides descriptive and technical information for the selected risk factor.
By default, risk factor details are collapsed to simplify navigation of the grid. You can expand multiple risk factors simultaneously to compare their information without closing previously opened entries.
| Section | Description |
| --------------------- | ------------------------------------------------------------------------------------------------------------------------------------------------------------------------------------ |
| **Description** | A plain-language explanation of the risk factor and its relevance to the selected endpoint. |
| **Technical Details** | Technical information associated with the risk factor on the selected endpoint. Depending on the risk factor type, the information may be displayed in a minimally processed format. |
## Risk Factors
The Risk factors grid contains the list of risk factors that were checked on the endpoint during the latest check, including their statuses and details.
### Risk Factors Grid
| Column | Shows |
| ------------------ | ------------------------------------------------------------------------------------------------------------------------------------------------------------------------------------------------------------ |
| **Risk Factor** | The name of the risk factor. Click it to open [Risk factor details](/docs/espm/riskfactors/risk-factors-details) including [remediation](/docs/espm/riskfactors/recommend-and-remedy) instructions. |
| **Control** | The list of the controls to which the risk factor belongs in the assigned policies. |
| **Risk Score** | The [risk level](/docs/espm/about-risk-factors#Risklevels) for the risk factor. If the risk factor belongs to several policies and has different severity in them, then the highest risk score will be displayed. |
| **Policy** | The policies containing the risk factor and assigned to the endpoint. Clicking a policy name opens the corresponding Policy page. |
| **First Detected** | The date and time when the risk factor was first detected as active on the endpoint. This value does not change even if the risk factor is remediated and later becomes active again. |
| **Last Detected** | The date and time when the risk factor was most recently detected as active. This typically matches the most recent scan time. |
| **Status** | The current [status](/docs/espm/about-risk-factors#risk-factor-statuses) of the risk factor on the endpoint: **Active**, **Not Applicable**, **No Evidence Found**, **Remediated**, or **No Longer Relevant**. |
### Grid Filters
By default, data in the grid is filtered by the Status column to display only Active risk factors. You can use other filters to find needed data. The filters include:
* Risk factor
* Control
* Policy
* Risk score by category (Critical, High, Medium, Low, or No Risk)
* Last detected date
* [Status](/docs/espm/about-risk-factors#risk-factor-statuses)
### Risk Factor Details
Expand a risk factor to view additional information about it. This is especially important for the active risk factors for understanding why it is considered a risk and what is to be remediated. The details panel provides descriptive and technical information for the selected risk factor.
By default, risk factor details are collapsed to simplify navigation of the grid. You can expand multiple risk factors simultaneously to compare their information without closing previously opened entries.
| Section | Description |
| --------------------- | ------------------------------------------------------------------------------------------------------------------------------------------------------------------------------------ |
| **Description** | A plain-language explanation of the risk factor and its relevance to the selected endpoint. |
| **Technical Details** | Technical information associated with the risk factor on the selected endpoint. Depending on the risk factor type, the information may be displayed in a minimally processed format. |
 ## Endpoint General Information (Details)
The **General information** section provides key details about the selected endpoint to help identify, locate, and manage the device.
Click **Details** to expand the section and view endpoint information. Click **Details** again to collapse the section when it is no longer needed.
The following information is displayed:
| Field | Description |
| ------------------- | ------------------------------------------------------------------------------ |
| **Endpoint Name** | The endpoint name as registered in Syteca. |
| **Domain** | The domain to which the endpoint belongs, or **N/A** if unavailable. |
| **IPv4** | The endpoint IPv4 address, or **N/A** if unavailable. |
| **IPv6** | The endpoint IPv6 address, or **N/A** if unavailable. |
| **OS** | The operating system name reported by the endpoint, or **N/A** if unavailable. |
| **OS Version** | The operating system version, or **N/A** if unavailable. |
| **OS Build** | The operating system build number, or **N/A** if unavailable. |
| **Endpoint Groups** | The endpoint groups to which the endpoint belongs. |
| **Description** | The endpoint description, if configured in Syteca, or **N/A** if unavailable. |
| **ESPM Module** | The installed ESPM module version. |
## Related
The history of endpoint health, policy assignments, and risk factor status changes
Risk factors and probes evaluation endpoints, risk scores calculation, and risk status changes throughout the remediation lifecycle.
Investigating risk factors affecting an endpoint, reviewing available technical details, and understanding what caused a risk to be detected.
Review historical endpoint health trends, policy assignment changes, and risk factor activity to understand how an endpoint's security posture has evolved over time.
## Endpoint General Information (Details)
The **General information** section provides key details about the selected endpoint to help identify, locate, and manage the device.
Click **Details** to expand the section and view endpoint information. Click **Details** again to collapse the section when it is no longer needed.
The following information is displayed:
| Field | Description |
| ------------------- | ------------------------------------------------------------------------------ |
| **Endpoint Name** | The endpoint name as registered in Syteca. |
| **Domain** | The domain to which the endpoint belongs, or **N/A** if unavailable. |
| **IPv4** | The endpoint IPv4 address, or **N/A** if unavailable. |
| **IPv6** | The endpoint IPv6 address, or **N/A** if unavailable. |
| **OS** | The operating system name reported by the endpoint, or **N/A** if unavailable. |
| **OS Version** | The operating system version, or **N/A** if unavailable. |
| **OS Build** | The operating system build number, or **N/A** if unavailable. |
| **Endpoint Groups** | The endpoint groups to which the endpoint belongs. |
| **Description** | The endpoint description, if configured in Syteca, or **N/A** if unavailable. |
| **ESPM Module** | The installed ESPM module version. |
## Related
The history of endpoint health, policy assignments, and risk factor status changes
Risk factors and probes evaluation endpoints, risk scores calculation, and risk status changes throughout the remediation lifecycle.
Investigating risk factors affecting an endpoint, reviewing available technical details, and understanding what caused a risk to be detected.
Review historical endpoint health trends, policy assignment changes, and risk factor activity to understand how an endpoint's security posture has evolved over time.