> ## Documentation Index
> Fetch the complete documentation index at: https://syteca.com/docs/llms.txt
> Use this file to discover all available pages before exploring further.
# Risk factor details
> View detailed information about a risk factor, including its detection history, affected endpoints, associated policies and controls, remediation guidance, and recommendations.
The **Risk Factor Details** page provides comprehensive information about a specific risk factor, including its description, operating systems, for which it is applicable, associated controls and policies, detection history, remediation guidance, and impact across managed endpoints. Use this page to understand the risk, determine its scope, and identify appropriate remediation actions.
## Risk Factor Overview
The **Risk Factor Overview** section contains general information about the selected risk factor.
| Field | Description |
| ---------------------------- | ------------------------------------------------------------------------------------------------------------------------------------------------------------------------------------------------------------------ |
| **Risk Factor** | The full name of the risk factor. |
| **OS** | The operating systems to which the risk factor applies. If the endpoint operating system is not listed, the risk factor will be marked as [not applicable](/docs/espm/about-risk-factors#not-applicable) after testing. |
| **Control** | The [controls](/docs/espm/about-policies#controls) associated with the risk factor. Clicking a control opens the [Risk factors page](/docs/espm/riskfactors/risk-factors-page) filtered by the selected control. |
| **Policy** | The [policies](/docs/espm/about-policies) that contain the risk factor. Clicking a policy opens the corresponding Policy page. |
| **First Detected in System** | The date and time when the risk factor was first detected anywhere in the system since Syteca ESPM was enabled. It is displayed as Server time in the current browser timezone. |
| **Last Detected in System** | The most recent date and time when the risk factor was detected on any endpoint in the system. It is displayed as Server time in the current browser timezone. |
| **Endpoints** | The number of available endpoints where the risk factor is currently active. Clicking the value opens the Endpoints page filtered by the selected risk factor. |
| **Description** | A detailed description of the risk factor and the associated security concern. |
## Remediation & Recommendation
The **Remediation** section provides guidance on resolving the risk factor and eliminating the underlying security issue.
The **Recommendations** section contains security best practices and preventive measures that can help reduce the likelihood of the risk occurring in the future.
For more information, see [Remediation and recommendations](/docs/espm/riskfactors/recommend-and-remedy).
## Top 10 Endpoint Groups
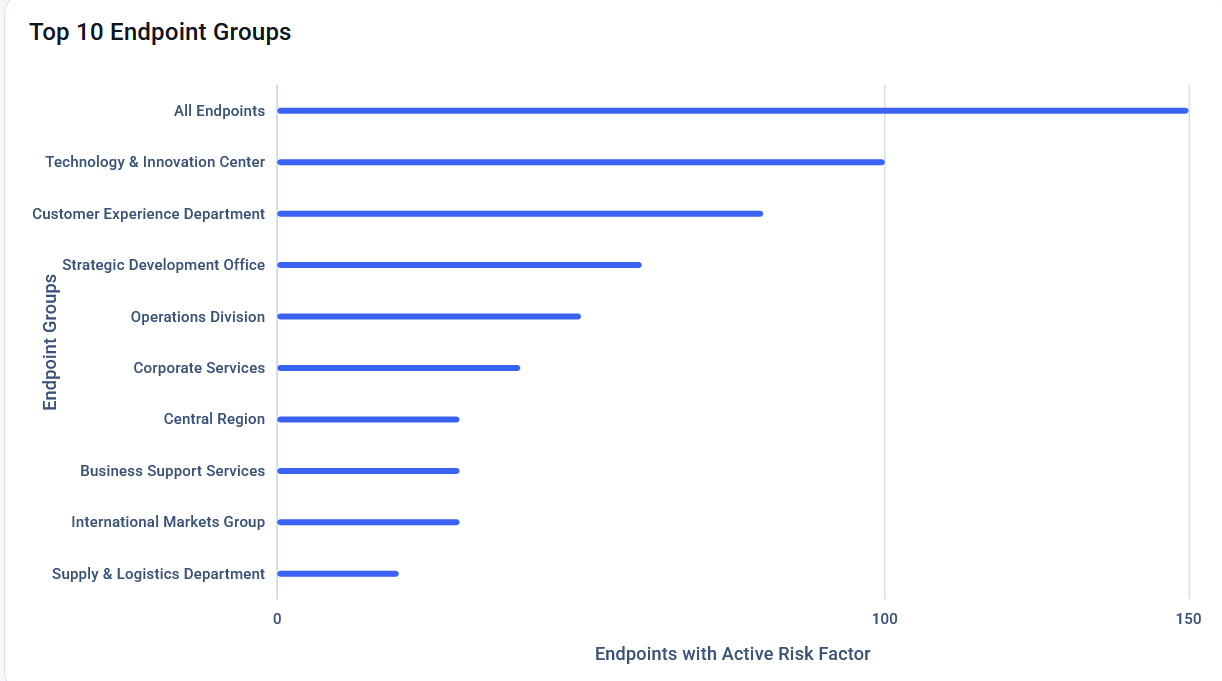
This widget contains a horizontal bar chart showing the endpoint groups most affected by the selected risk factor.
The chart displays up to 10 endpoint groups, ordered by the number of endpoints where the risk factor is currently active. Longer bars indicate a greater number of affected endpoints in the group. Clicking a bar opens the Endpoints page filtered by both the selected risk factor and endpoint group.
Hover over a bar to view the number of affected endpoints within the group.
Only endpoints available to the current user are included in the chart calculations.
 ## Related
Understand how risk factors and probes are evaluated on endpoints.
Monitor your endpoint security posture through widgets that highlight overall health, endpoint group health, active risk factors, and more.
View detailed remediation instructions and security recommendations for each risk factor to help resolve identified issues and reduce future risk.
Investigate risk factors affecting an endpoint, review available technical details, and understand the underlying conditions or activities that caused a risk to be detected.
## Related
Understand how risk factors and probes are evaluated on endpoints.
Monitor your endpoint security posture through widgets that highlight overall health, endpoint group health, active risk factors, and more.
View detailed remediation instructions and security recommendations for each risk factor to help resolve identified issues and reduce future risk.
Investigate risk factors affecting an endpoint, review available technical details, and understand the underlying conditions or activities that caused a risk to be detected.