> ## Documentation Index
> Fetch the complete documentation index at: https://syteca.com/docs/llms.txt
> Use this file to discover all available pages before exploring further.
# Syteca Logs
> Download and configure Application Server, Management Tool, and Client log files for troubleshooting or for the Syteca Support team.
When contacting the Syteca Support team about an issue, attach the relevant log files to your email if possible. This page covers how to collect logs for the Application Server, the Management Tool, and Clients, and how to change each component's log level.
Log Collector tools can generate the required files automatically, without navigating the Management Tool or the file system directly:
* **Application Server:** `https://syteca.com/log-collectors/SytecaServer_LogsCollector.exe`
* **Clients:** `https://syteca.com/log-collectors/SytecaClient_LogsCollector.exe`
Running a tool generates the log files on the desktop of the corresponding endpoint computer.
## Application Server logs
**NOT AVAILABLE IN SAAS.**
Open the [System Health](/docs/administration/dashboards/system-health-dashboards) page and select the **System State** tab.
Choose **Download Log Files (MT and Server)** from the drop-down list.
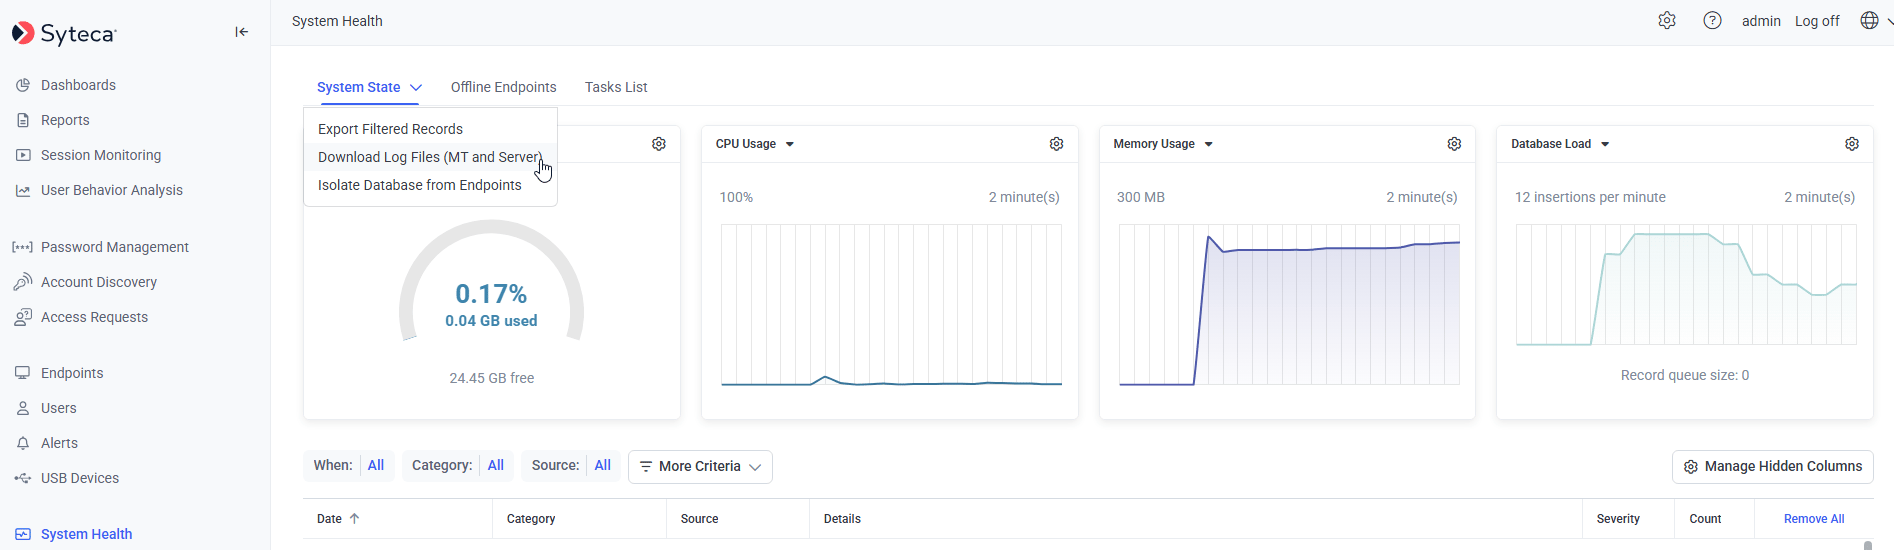 Alternatively, find the log files directly on the Application Server computer at `C:\Program Files\Ekran System\Ekran System\ServerLogs`.
### Application Server log levels
| Level | Value | Records |
| ------------------ | ----- | -------------------------------------------------------- |
| **Error** | 1 | Critical (fatal) and non-critical error events only. |
| **Warning** | 2 | Warning events plus critical error events. |
| **Info** (default) | 3 | All events: warnings, critical, and non-critical errors. |
| **Debug** | 4 | All Application Server transactions. |
Click **Configuration** at the top of the Management Tool, then select the **System Settings** tab.
Scroll to the **Server Log Settings** section at the bottom, select the required level, and click **Save**.
On the Application Server computer, open `EkranServer.Settings.config` (located in `C:\Program Files\Ekran System\Ekran System\Server`) as an administrator.
```xml theme={"system"}
```
Restart the **EkranServer** service.
After investigating an issue, change the level back to **Info** — leaving Debug enabled generates significantly more log data than needed for normal operation.
## Management Tool logs
**NOT AVAILABLE IN SAAS.**
Download Management Tool logs the same way as Application Server logs: open [System Health](/docs/administration/dashboards/system-health-dashboards) → **System State** tab → **Download Log Files (MT and Server)**.
If the Management Tool isn't accessible, find the log files directly on the computer where the Management Tool is installed, at `C:\Users\SYTECAManagementTool\AppData\Local`.
## Client logs
Select the checkboxes next to the Clients whose logs you need.
Click **Bulk Action**, then select **Download Logs**.
Logs can only be downloaded through the Management Tool for Clients that are currently online. For offline Clients, collect logs locally on the Client computer using the steps below.
### Collect logs locally, by OS
Windows Client logs consist of two parts:
* **Client logs**, stored at `C:\Program Files\Ekran System\Ekran System\ClientLogs`.
* **Syteca Connection Manager logs** (when Connection Manager is used), stored at `C:\Users\\AppData\Local\Syteca`.
```bash theme={"system"}
cd /opt/.Ekran
```
```bash theme={"system"}
sudo ./getenv.sh
```
This creates an archive containing the logs in the same folder.
Two additional log files exist outside this archive, at `/var/.ekran/logs/`:
| File | Contains |
| ------------------- | --------------------------------------------------------------------------------------------------------------------------------------------------------------------------------------------------------------------------- |
| `LoginsLogouts.log` | Every remote SSH login/logout to or from the Client machine, whether the session was recorded, and the session type (ssh/sftp/scp). Only populated when additional data-collection software (e.g. a SIEM system) is in use. |
| `rescue.log` | Timestamps, hostname, username, recorder PID, and reason for each time the Client entered or exited [Rescue mode](/docs/administration/clients/linux#yellow-status-icon-rescue-mode). |
`LoginsLogouts.log` never records session content or user passwords — only login/logout metadata. `scp` and `sftp` sessions aren't recorded by the Client and are logged as "will not be recorded."
```bash theme={"system"}
open /Library/Application\ Support/Ekran
```
Run `pack_agent_data.sh` to create an archive containing the logs on the desktop.
### Client log levels
| Level | Value | Records |
| ------------------ | ----- | -------------------------------------------------------- |
| **Error** | 1 | Critical (fatal) and non-critical error events only. |
| **Warning** | 2 | Warning events plus critical error events. |
| **Info** (default) | 3 | All events: warnings, critical, and non-critical errors. |
| **Debug** | 4 | All Client transactions. |
On the **Clients** page, click the Client's name, select the **Properties** tab on the **Editing Client** page, and scroll to the **Diagnostics** section at the bottom.
In Registry Editor, go to `HKEY_LOCAL_MACHINE\SOFTWARE\EkranSystem\Client` and add a **DWORD (32-bit)** value named `TraceLogLevel` with data `3`.
Restart the **EkranClient** service.
```bash theme={"system"}
cd /etc/.ekran
```
Open `settings.xml` as `root` in a text editor (for example `nano`).
Change the `AgentLogLevel` value, then save.
Restart the Linux Client machine to apply the change.
```bash theme={"system"}
sudo nano /opt/.Ekran/settings.xml
```
Change the `AgentLogLevel` value, then save.
Restart the `sytecad` process.
If there's no connection to the Application Server, a locally changed log level takes effect immediately. Once connectivity is restored, the level reverts to whatever is configured in the Management Tool.
### Syteca Connection Manager logs
Found at `C:\Users\\AppData\Local\Syteca`.
## Monitoring logs (Windows and macOS Clients)
Monitoring logs are text files written on the Client computer, separate from the [Client diagnostic logs](#client-logs) covered above.
On the **Editing Client** / **Editing Client Group** page, select the **Monitoring \[Windows/macOS]** tab.
In the **Log Files** section, select **Enable creating log files of monitored events**.
Enter a path in the log location field. Environment variables like `%appdata%` and `%temp%` are supported.
Two files are created:
| File | Contains |
| --------------------- | --------------------------------------------------------------------------------------------------------- |
| `Client_` | Monitored activity: timestamp, session ID, Client host name, user name, activity title, application name. |
| `Login_` | Every login to the Client computer: timestamp, host name, user name. |
If the configured location isn't accessible or is write-protected, logs save instead to `\ProgramData\Ekran System\MonLogs`. Changing the location later doesn't move existing log files — they stay where they were, and new files start in the new location.
### Example configurations
| Intent | `.ini` parameters | Management Tool equivalent |
| ------------------- | --------------------------------------------------- | ------------------------------------------------------------- |
| No monitoring logs | `MonLogging=0`
Alternatively, find the log files directly on the Application Server computer at `C:\Program Files\Ekran System\Ekran System\ServerLogs`.
### Application Server log levels
| Level | Value | Records |
| ------------------ | ----- | -------------------------------------------------------- |
| **Error** | 1 | Critical (fatal) and non-critical error events only. |
| **Warning** | 2 | Warning events plus critical error events. |
| **Info** (default) | 3 | All events: warnings, critical, and non-critical errors. |
| **Debug** | 4 | All Application Server transactions. |
Click **Configuration** at the top of the Management Tool, then select the **System Settings** tab.
Scroll to the **Server Log Settings** section at the bottom, select the required level, and click **Save**.
On the Application Server computer, open `EkranServer.Settings.config` (located in `C:\Program Files\Ekran System\Ekran System\Server`) as an administrator.
```xml theme={"system"}
```
Restart the **EkranServer** service.
After investigating an issue, change the level back to **Info** — leaving Debug enabled generates significantly more log data than needed for normal operation.
## Management Tool logs
**NOT AVAILABLE IN SAAS.**
Download Management Tool logs the same way as Application Server logs: open [System Health](/docs/administration/dashboards/system-health-dashboards) → **System State** tab → **Download Log Files (MT and Server)**.
If the Management Tool isn't accessible, find the log files directly on the computer where the Management Tool is installed, at `C:\Users\SYTECAManagementTool\AppData\Local`.
## Client logs
Select the checkboxes next to the Clients whose logs you need.
Click **Bulk Action**, then select **Download Logs**.
Logs can only be downloaded through the Management Tool for Clients that are currently online. For offline Clients, collect logs locally on the Client computer using the steps below.
### Collect logs locally, by OS
Windows Client logs consist of two parts:
* **Client logs**, stored at `C:\Program Files\Ekran System\Ekran System\ClientLogs`.
* **Syteca Connection Manager logs** (when Connection Manager is used), stored at `C:\Users\\AppData\Local\Syteca`.
```bash theme={"system"}
cd /opt/.Ekran
```
```bash theme={"system"}
sudo ./getenv.sh
```
This creates an archive containing the logs in the same folder.
Two additional log files exist outside this archive, at `/var/.ekran/logs/`:
| File | Contains |
| ------------------- | --------------------------------------------------------------------------------------------------------------------------------------------------------------------------------------------------------------------------- |
| `LoginsLogouts.log` | Every remote SSH login/logout to or from the Client machine, whether the session was recorded, and the session type (ssh/sftp/scp). Only populated when additional data-collection software (e.g. a SIEM system) is in use. |
| `rescue.log` | Timestamps, hostname, username, recorder PID, and reason for each time the Client entered or exited [Rescue mode](/docs/administration/clients/linux#yellow-status-icon-rescue-mode). |
`LoginsLogouts.log` never records session content or user passwords — only login/logout metadata. `scp` and `sftp` sessions aren't recorded by the Client and are logged as "will not be recorded."
```bash theme={"system"}
open /Library/Application\ Support/Ekran
```
Run `pack_agent_data.sh` to create an archive containing the logs on the desktop.
### Client log levels
| Level | Value | Records |
| ------------------ | ----- | -------------------------------------------------------- |
| **Error** | 1 | Critical (fatal) and non-critical error events only. |
| **Warning** | 2 | Warning events plus critical error events. |
| **Info** (default) | 3 | All events: warnings, critical, and non-critical errors. |
| **Debug** | 4 | All Client transactions. |
On the **Clients** page, click the Client's name, select the **Properties** tab on the **Editing Client** page, and scroll to the **Diagnostics** section at the bottom.
In Registry Editor, go to `HKEY_LOCAL_MACHINE\SOFTWARE\EkranSystem\Client` and add a **DWORD (32-bit)** value named `TraceLogLevel` with data `3`.
Restart the **EkranClient** service.
```bash theme={"system"}
cd /etc/.ekran
```
Open `settings.xml` as `root` in a text editor (for example `nano`).
Change the `AgentLogLevel` value, then save.
Restart the Linux Client machine to apply the change.
```bash theme={"system"}
sudo nano /opt/.Ekran/settings.xml
```
Change the `AgentLogLevel` value, then save.
Restart the `sytecad` process.
If there's no connection to the Application Server, a locally changed log level takes effect immediately. Once connectivity is restored, the level reverts to whatever is configured in the Management Tool.
### Syteca Connection Manager logs
Found at `C:\Users\\AppData\Local\Syteca`.
## Monitoring logs (Windows and macOS Clients)
Monitoring logs are text files written on the Client computer, separate from the [Client diagnostic logs](#client-logs) covered above.
On the **Editing Client** / **Editing Client Group** page, select the **Monitoring \[Windows/macOS]** tab.
In the **Log Files** section, select **Enable creating log files of monitored events**.
Enter a path in the log location field. Environment variables like `%appdata%` and `%temp%` are supported.
Two files are created:
| File | Contains |
| --------------------- | --------------------------------------------------------------------------------------------------------- |
| `Client_` | Monitored activity: timestamp, session ID, Client host name, user name, activity title, application name. |
| `Login_` | Every login to the Client computer: timestamp, host name, user name. |
If the configured location isn't accessible or is write-protected, logs save instead to `\ProgramData\Ekran System\MonLogs`. Changing the location later doesn't move existing log files — they stay where they were, and new files start in the new location.
### Example configurations
| Intent | `.ini` parameters | Management Tool equivalent |
| ------------------- | --------------------------------------------------- | ------------------------------------------------------------- |
| No monitoring logs | `MonLogging=0`
`LogPath=` | Deselect **Enable creating log files of monitored events**. |
| Default location | `MonLogging=1`
`LogPath=` | Select the checkbox, leave the location field empty. |
| Custom folder | `MonLogging=1`
`LogPath=C:\1\Logs` | Select the checkbox, set location to `C:\1\Logs`. |
| User profile folder | `MonLogging=1`
`LogPath=%AppData%\EKRAN\_Logs` | Select the checkbox, set location to `%AppData%\EKRAN\_Logs`. |
## Related
Where log downloads and system state live in the Management Tool.
Diagnosing Clients that have gone offline.
Windows Client installation and configuration.
Linux Client installation and configuration.