> ## Documentation Index
> Fetch the complete documentation index at: https://syteca.com/docs/llms.txt
> Use this file to discover all available pages before exploring further.
# The Alerts Events Tab
> Review and triage every alert event in Syteca from one place — the Alerts tab on the Activity Monitoring page, with status workflow, notes, and bulk triage.
Every time an [alert](/docs/session-monitoring/alerts) or [USB monitoring rule](/docs/session-monitoring/usb-devices/usb-rules) triggers on any Client, a record is added to the **Alerts** tab on the **Activity Monitoring** page. This is the central triage surface — one grid showing every alert event, with status, notes, and direct playback links into the moment the alert triggered.
For the alert rules themselves (definition, conditions, assignments), see the [Alerts page](/docs/session-monitoring/alerts). For automated *blocking* when an alert triggers, see [Block on alert](/docs/session-monitoring/block-on-alert#block-automatically-when-an-alert-triggers).
Viewing the Alerts tab requires the [administrative Viewing Monitoring Results permission](/docs/administration/users/administrative-permissions). Within that, users only see alert events on Clients and users they have **User-to-User access permissions** for, configured on the **User Access** tab when [adding or editing the Management Tool user](/docs/administration/users/users) or [user group](/docs/administration/users/users#add-a-user-group).
## Open the Alerts tab
Sign in to the Management Tool, click **Activity Monitoring** in the left navigation, then select the **Alerts** tab.
The grid refreshes automatically every 60 seconds.
## The grid
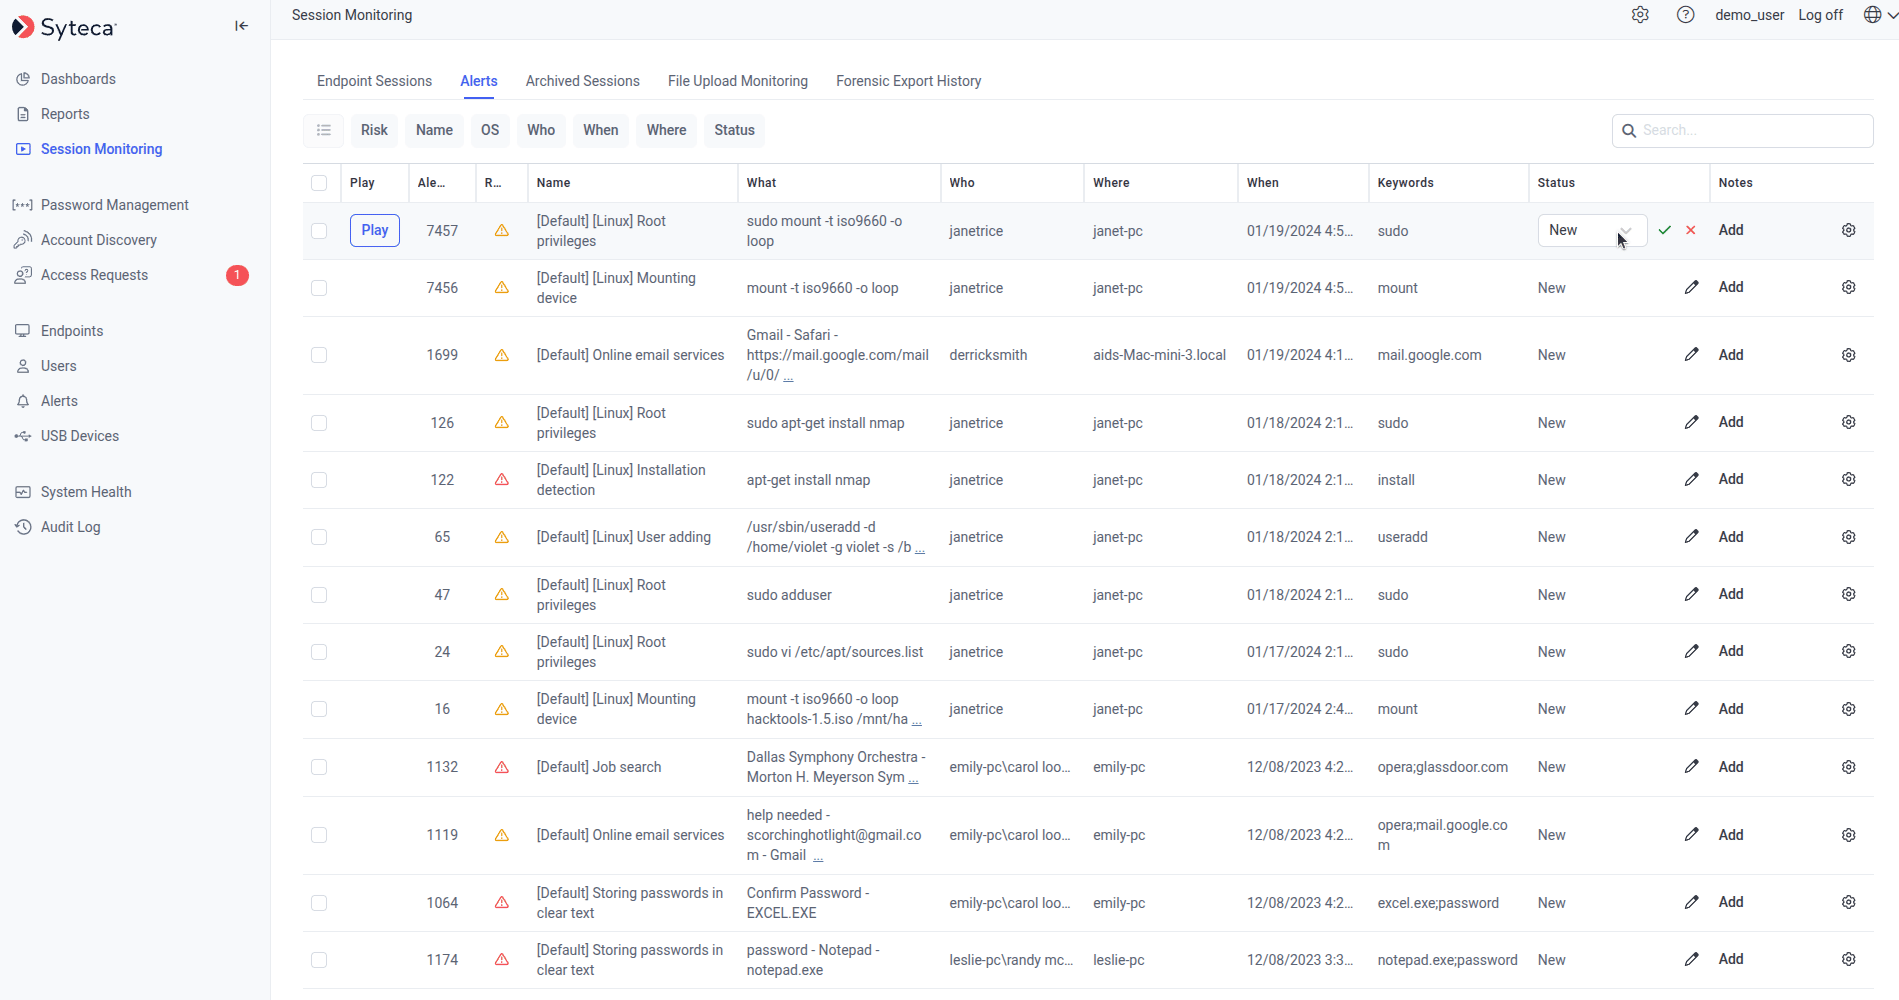 | Column | Shows |
| ----------------------- | -------------------------------------------------------------------------------------------------------------------------------------------- |
| **Select** *(checkbox)* | Select alerts for [Bulk Action](#bulk-action), or use the column-header checkbox to select all. |
| **Play** *(icon)* | Open the corresponding session in the [Session Viewer](/docs/session-monitoring/player/overview), paused at the exact moment the alert triggered. |
| **Alert ID** | The unique ID of the alert event. |
| **Risk** | The risk level — a **red** icon for Critical, **orange** for High, **blue** for Normal. |
| **Name** | The name of the alert triggered. |
| **Description** | Description of the alert. |
| **What** | The user activity that triggered the alert. |
| **Who** | The user who triggered the alert. |
| **Where** | The Client computer where the alert triggered. |
| **When** | When the alert triggered. |
| **Keywords** | The values defined in the alert rule(s) that triggered the alert. |
| **Status** | Current status — **New**, **In Progress**, **Confirmed Risk**, **False Alarm**, or **Resolved**. Editable via the **Edit** icon. |
| **Notes** | Click **Add** to attach notes; the count appears in brackets (e.g. `(+2)`). |
| **Settings** *(icon)* | Edit the alert rule itself on the [Alerts page](/docs/session-monitoring/alerts). |
## Filter, search, and sort
| Action | How |
| ----------------------- | ------------------------------------------------------------------------------------------------------------------------------------------------------------------------ |
| **Filter** | Click any filter button at the top — **Risk**, **Name**, **OS**, **Who**, **When**, **Where**, **Status** — and select one or more checkboxes. Multiple filters combine. |
| **Search** | Enter a keyword in the **Search** box in the top right. |
| **Sort** | Click any column header *(except Description)*. Click again to reverse. The up/down arrow shows the current direction. |
| **Adjust column width** | Drag column separators. |
| **Load more** | Click **Load More** at the bottom of the page to display an additional 50 records. |
## Update the status of an alert event
The status field tracks the lifecycle of each alert — from initial detection to final resolution.
| Status | Meaning |
| ------------------ | ----------------------------------------------------------------------------------- |
| **New** | The alert just triggered; no one has reviewed it yet. |
| **In Progress** | Someone is actively investigating. |
| **Confirmed Risk** | Investigation confirmed this was a real incident. |
| **False Alarm** | Investigation confirmed this was a false positive — the alert rule may need tuning. |
| **Resolved** | The incident has been handled and closed. |
To change the status of one alert, click the **Edit** icon next to the alert event and select the new status from the drop-down. To change many alerts at once, see [Bulk Action](#bulk-action) below.
## Notes
Add free-text notes to alert events to document your investigation:
Click the **Add** button next to the alert event.
Click **Add a note** to attach a new note. To delete a note, click the **Remove** icon next to it.
Notes can only be removed by the user who added them (or by the built-in admin user). The count of notes appears in brackets (e.g. `(+2)`) next to the **Add** button.
## Bulk Action
Select multiple alerts with the checkboxes (or **Select All** in the column header), then click the **Bulk Action** button in the top left to update the status of all selected alerts simultaneously.
## Related
Define and assign the alert rules that trigger the events on this tab.
Automatically block users when an alert triggers — go beyond notification.
USB rule triggers also surface as alert events on this tab.
Where the Play icon opens the recorded session at the alert moment.
| Column | Shows |
| ----------------------- | -------------------------------------------------------------------------------------------------------------------------------------------- |
| **Select** *(checkbox)* | Select alerts for [Bulk Action](#bulk-action), or use the column-header checkbox to select all. |
| **Play** *(icon)* | Open the corresponding session in the [Session Viewer](/docs/session-monitoring/player/overview), paused at the exact moment the alert triggered. |
| **Alert ID** | The unique ID of the alert event. |
| **Risk** | The risk level — a **red** icon for Critical, **orange** for High, **blue** for Normal. |
| **Name** | The name of the alert triggered. |
| **Description** | Description of the alert. |
| **What** | The user activity that triggered the alert. |
| **Who** | The user who triggered the alert. |
| **Where** | The Client computer where the alert triggered. |
| **When** | When the alert triggered. |
| **Keywords** | The values defined in the alert rule(s) that triggered the alert. |
| **Status** | Current status — **New**, **In Progress**, **Confirmed Risk**, **False Alarm**, or **Resolved**. Editable via the **Edit** icon. |
| **Notes** | Click **Add** to attach notes; the count appears in brackets (e.g. `(+2)`). |
| **Settings** *(icon)* | Edit the alert rule itself on the [Alerts page](/docs/session-monitoring/alerts). |
## Filter, search, and sort
| Action | How |
| ----------------------- | ------------------------------------------------------------------------------------------------------------------------------------------------------------------------ |
| **Filter** | Click any filter button at the top — **Risk**, **Name**, **OS**, **Who**, **When**, **Where**, **Status** — and select one or more checkboxes. Multiple filters combine. |
| **Search** | Enter a keyword in the **Search** box in the top right. |
| **Sort** | Click any column header *(except Description)*. Click again to reverse. The up/down arrow shows the current direction. |
| **Adjust column width** | Drag column separators. |
| **Load more** | Click **Load More** at the bottom of the page to display an additional 50 records. |
## Update the status of an alert event
The status field tracks the lifecycle of each alert — from initial detection to final resolution.
| Status | Meaning |
| ------------------ | ----------------------------------------------------------------------------------- |
| **New** | The alert just triggered; no one has reviewed it yet. |
| **In Progress** | Someone is actively investigating. |
| **Confirmed Risk** | Investigation confirmed this was a real incident. |
| **False Alarm** | Investigation confirmed this was a false positive — the alert rule may need tuning. |
| **Resolved** | The incident has been handled and closed. |
To change the status of one alert, click the **Edit** icon next to the alert event and select the new status from the drop-down. To change many alerts at once, see [Bulk Action](#bulk-action) below.
## Notes
Add free-text notes to alert events to document your investigation:
Click the **Add** button next to the alert event.
Click **Add a note** to attach a new note. To delete a note, click the **Remove** icon next to it.
Notes can only be removed by the user who added them (or by the built-in admin user). The count of notes appears in brackets (e.g. `(+2)`) next to the **Add** button.
## Bulk Action
Select multiple alerts with the checkboxes (or **Select All** in the column header), then click the **Bulk Action** button in the top left to update the status of all selected alerts simultaneously.
## Related
Define and assign the alert rules that trigger the events on this tab.
Automatically block users when an alert triggers — go beyond notification.
USB rule triggers also surface as alert events on this tab.
Where the Play icon opens the recorded session at the alert moment.