> ## Documentation Index
> Fetch the complete documentation index at: https://syteca.com/docs/llms.txt
> Use this file to discover all available pages before exploring further.
# User Activity Dashboards
> Generate and view administrator dashboards of endpoint user activity in Syteca — application use, website use, idle vs active time, alerts, and live sessions.
The **Dashboards** page in the Management Tool gives administrators a single place to view interactive, customizable charts and tables built from the activity Syteca records on monitored endpoints. Use it for system-wide visibility into productivity patterns, application and website use, alerts triggered, and live sessions.
A Management Tool user needs the [Viewing Monitoring Results administrative permission](/docs/administration/users/administrative-permissions) to access the Dashboards page. Only data for the Clients that the user has the [Viewing Monitoring Results permission for Clients](/docs/administration/users/client-permissions) is shown.
For best dashboard performance with PostgreSQL, update the database to version 13 or higher.
## Customize the dashboards
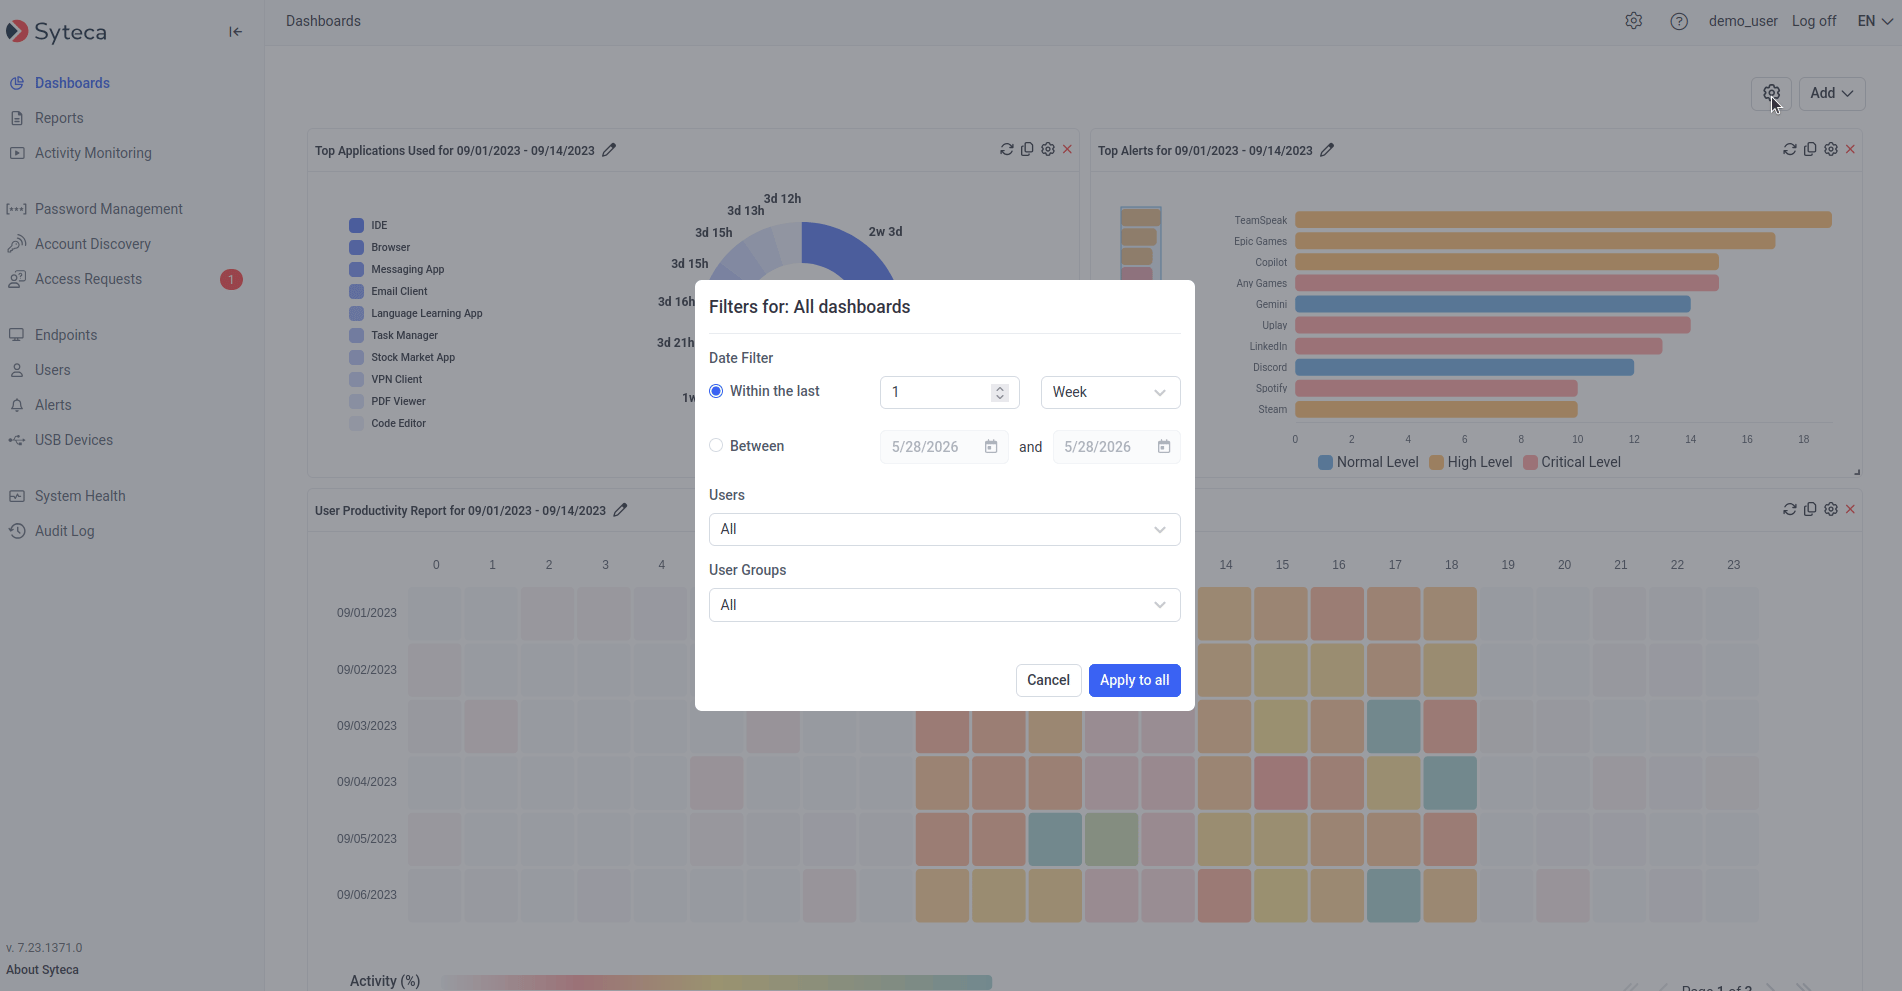
You can change filter settings globally (every dashboard at once) or per-dashboard. Per-dashboard settings can be a subset *or* a wider range than the global filter — they're independent.
Click **Dashboards** in the left navigation, then click **Filter Settings** in the top right of the page.
In the pop-up, choose **Within the last** or **Between**, set the date range, **Users**, and **User Groups**, then click **Apply to All**.
With large amounts of session data (or none), it can take up to 2 minutes — the default timeout — to generate the data. See [troubleshooting](#troubleshooting).
Click the **Filter Settings** icon on any individual dashboard to set its own date range, users, user groups, and other dashboard-specific options.
 ### Add, rearrange, resize, rename, hide
A maximum of **18 dashboards** can be added to the page at the same time — multiple copies of the same type are allowed, each filtered independently.
* **Add a dashboard** — click **Add** in the top right and pick a type.
* **Duplicate a dashboard** — click the **Copy** icon in any dashboard's top right; a duplicate is added below it and can be filtered independently.
* **Rename a dashboard** — click the **Edit** icon next to the dashboard name.
* **Resize a dashboard** — drag the bottom-right corner.
* **Rearrange** — drag the dashboard header to a new location.
* **Hide a dashboard** — click the **Remove** icon in its top right.
## The 9 dashboard types
One of each type is shown by default. Each entry below describes the visualization and the per-dashboard filters available.
### Total Idle Time vs Active Time
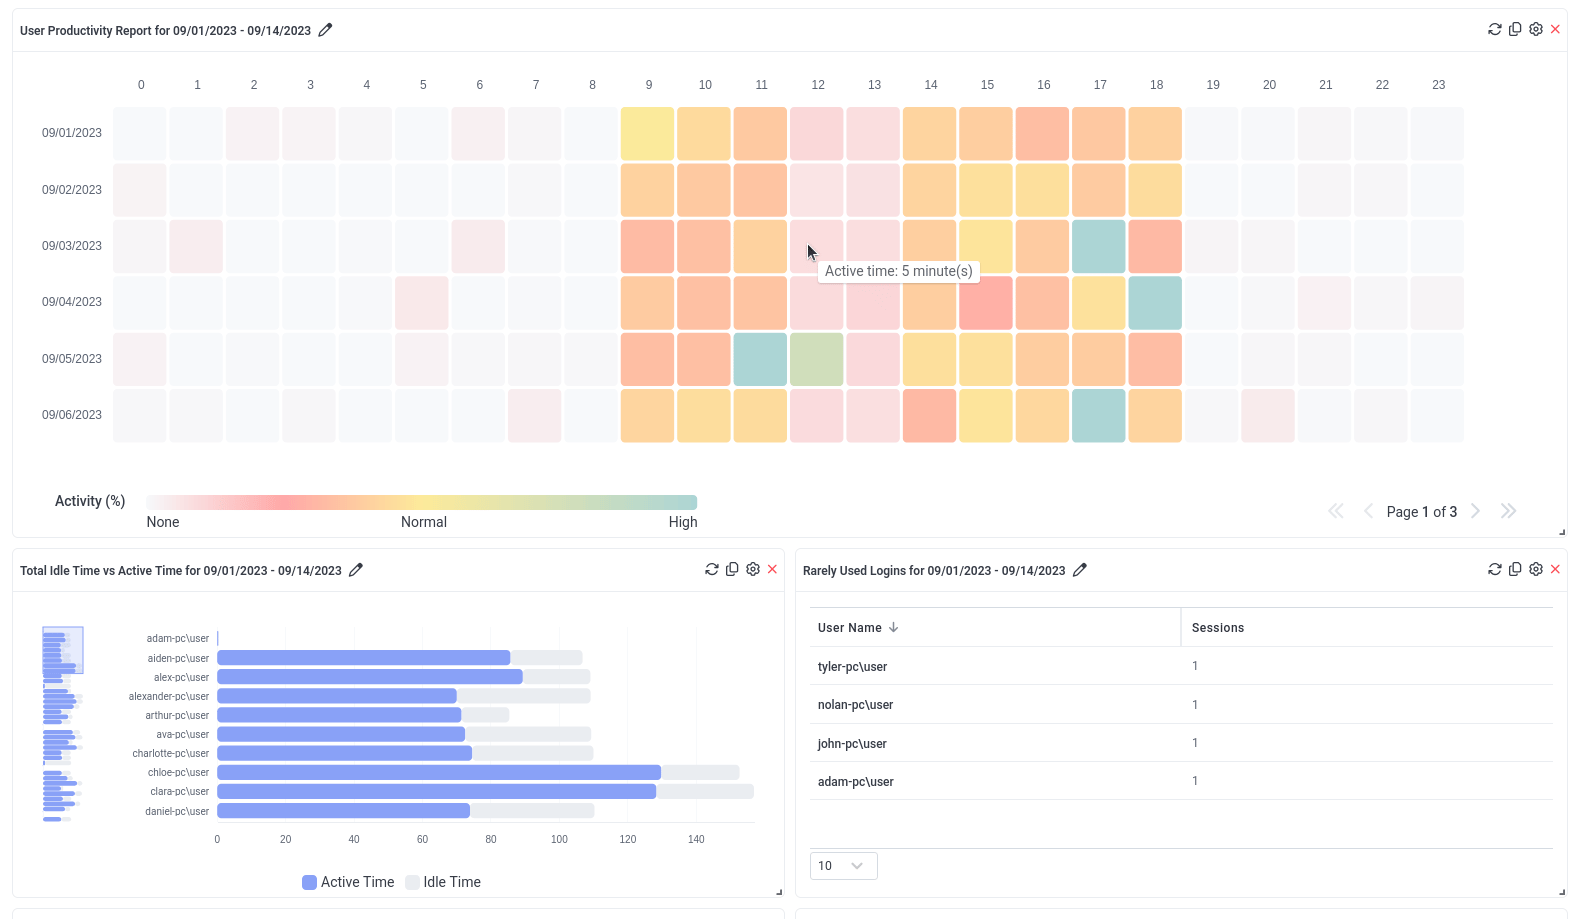
A bar chart of Total Active Time vs Total Idle Time per user (or per user group) across all their sessions in the date range. Active Time is *Total Session Time − Total Idle Time*.
Up to 10 bars are shown; a vertical slider scrolls to the rest. Click any bar to open a session list, where the **Play** icon opens a session in the [Session Viewer](/docs/session-monitoring/player/overview).
| Filter | |
| ------------------------------------------- | ----------------------------------------------------------------- |
| **Date Filter**, **Users**, **User Groups** | Standard filters. |
| **Report Level** | Select **User** or **Group** — controls what each bar represents. |
Idle event recording is not implemented for SSH sessions on Linux Clients. Data with less than 1 minute of user activity is excluded.
### Top Applications Used
A pie chart of the 10 applications with the longest total usage time across all selected users in the date range. Click a segment or application name to open a filtered session list. Filters: **Date Filter**, **Users**, **User Groups**.
Data with less than 1 minute of user activity is excluded.
### Top Websites Used
A pie chart of the 10 websites with the longest total time spent across all selected users in the date range. Lower-level URLs are aggregated under their top-level domain. Click a segment or website name for a filtered session list. Filters: **Date Filter**, **Users**, **User Groups**.
URL monitoring is implemented for Windows and macOS Clients only — not Linux. Data with less than 1 minute of user activity is excluded.
### User Productivity Report
A heatmap of average active minutes per hour, for each day in the date range. Each row is a day; each of the 24 cells is an hour, color-coded by activity percentage (see the **Activity (%)** key below the chart).
Average Active Time per hour = sum of users' active minutes ÷ number of users. Active Time for one user for one hour = one hour − Total Idle Time. Hover any cell to see the value; paginate with the page arrows below the chart. Filters: **Date Filter**, **Users**, **User Groups**.
Idle event recording is not implemented for SSH sessions on Linux Clients.
### Top Alerts
A bar chart of up to the 20 most-triggered alerts in the date range, ordered by frequency. Bar length is the notification count; bar color is the alert risk level. Up to 10 bars shown, with a slider for the rest. Click any bar for the underlying alert events (start date, Client name, user name, **Play** button). Filters: **Date Filter**, **Users**, **User Groups**.
### Latest Live Sessions
A sortable grid of the most-recently started sessions currently live, with **Start**, **Client Name**, and **User Name** columns plus a **Play** button. Filters: **Users**, **User Groups**, and **Number of Sessions** *(maximum sessions to show)*.
### Sessions Outside of Work Hours
A bar chart of sessions started during non-work hours and non-work days in the date range, ordered by date. Up to 10 bars; slider for the rest. Click any bar for the session list (Client name, user name, start, last activity, finish, **Play**).
| Filter | |
| ------------------------------------------- | ------------------------------------------------- |
| **Date Filter**, **Users**, **User Groups** | Standard filters. |
| **Work Hours** | Hours of the week treated as standard work hours. |
| **Work Days** | Days of the week treated as standard work days. |
Only sessions with user activity outside the specified standard work schedule are shown.
### Rarely Used Logins
A sortable grid of users with the fewest logins in the date range. Columns: **User Name** *(with the secondary-authentication user in brackets if enabled)* and **Sessions**. Click a user name for their session details and a **Play** button. Filters: **Date Filter**, **Users**, **User Groups**, and **Sessions fewer than** *(threshold for inclusion)*.
### Rarely Used Computers
A sortable grid of Client computers with the fewest sessions in the date range. Columns: **Client Name** and **Sessions**. Click a Client name for its session details and a **Play** button. Filters: **Date Filter**, **Users**, **User Groups**, and **Sessions fewer than** *(threshold for inclusion)*.
### Add, rearrange, resize, rename, hide
A maximum of **18 dashboards** can be added to the page at the same time — multiple copies of the same type are allowed, each filtered independently.
* **Add a dashboard** — click **Add** in the top right and pick a type.
* **Duplicate a dashboard** — click the **Copy** icon in any dashboard's top right; a duplicate is added below it and can be filtered independently.
* **Rename a dashboard** — click the **Edit** icon next to the dashboard name.
* **Resize a dashboard** — drag the bottom-right corner.
* **Rearrange** — drag the dashboard header to a new location.
* **Hide a dashboard** — click the **Remove** icon in its top right.
## The 9 dashboard types
One of each type is shown by default. Each entry below describes the visualization and the per-dashboard filters available.
### Total Idle Time vs Active Time
A bar chart of Total Active Time vs Total Idle Time per user (or per user group) across all their sessions in the date range. Active Time is *Total Session Time − Total Idle Time*.
Up to 10 bars are shown; a vertical slider scrolls to the rest. Click any bar to open a session list, where the **Play** icon opens a session in the [Session Viewer](/docs/session-monitoring/player/overview).
| Filter | |
| ------------------------------------------- | ----------------------------------------------------------------- |
| **Date Filter**, **Users**, **User Groups** | Standard filters. |
| **Report Level** | Select **User** or **Group** — controls what each bar represents. |
Idle event recording is not implemented for SSH sessions on Linux Clients. Data with less than 1 minute of user activity is excluded.
### Top Applications Used
A pie chart of the 10 applications with the longest total usage time across all selected users in the date range. Click a segment or application name to open a filtered session list. Filters: **Date Filter**, **Users**, **User Groups**.
Data with less than 1 minute of user activity is excluded.
### Top Websites Used
A pie chart of the 10 websites with the longest total time spent across all selected users in the date range. Lower-level URLs are aggregated under their top-level domain. Click a segment or website name for a filtered session list. Filters: **Date Filter**, **Users**, **User Groups**.
URL monitoring is implemented for Windows and macOS Clients only — not Linux. Data with less than 1 minute of user activity is excluded.
### User Productivity Report
A heatmap of average active minutes per hour, for each day in the date range. Each row is a day; each of the 24 cells is an hour, color-coded by activity percentage (see the **Activity (%)** key below the chart).
Average Active Time per hour = sum of users' active minutes ÷ number of users. Active Time for one user for one hour = one hour − Total Idle Time. Hover any cell to see the value; paginate with the page arrows below the chart. Filters: **Date Filter**, **Users**, **User Groups**.
Idle event recording is not implemented for SSH sessions on Linux Clients.
### Top Alerts
A bar chart of up to the 20 most-triggered alerts in the date range, ordered by frequency. Bar length is the notification count; bar color is the alert risk level. Up to 10 bars shown, with a slider for the rest. Click any bar for the underlying alert events (start date, Client name, user name, **Play** button). Filters: **Date Filter**, **Users**, **User Groups**.
### Latest Live Sessions
A sortable grid of the most-recently started sessions currently live, with **Start**, **Client Name**, and **User Name** columns plus a **Play** button. Filters: **Users**, **User Groups**, and **Number of Sessions** *(maximum sessions to show)*.
### Sessions Outside of Work Hours
A bar chart of sessions started during non-work hours and non-work days in the date range, ordered by date. Up to 10 bars; slider for the rest. Click any bar for the session list (Client name, user name, start, last activity, finish, **Play**).
| Filter | |
| ------------------------------------------- | ------------------------------------------------- |
| **Date Filter**, **Users**, **User Groups** | Standard filters. |
| **Work Hours** | Hours of the week treated as standard work hours. |
| **Work Days** | Days of the week treated as standard work days. |
Only sessions with user activity outside the specified standard work schedule are shown.
### Rarely Used Logins
A sortable grid of users with the fewest logins in the date range. Columns: **User Name** *(with the secondary-authentication user in brackets if enabled)* and **Sessions**. Click a user name for their session details and a **Play** button. Filters: **Date Filter**, **Users**, **User Groups**, and **Sessions fewer than** *(threshold for inclusion)*.
### Rarely Used Computers
A sortable grid of Client computers with the fewest sessions in the date range. Columns: **Client Name** and **Sessions**. Click a Client name for its session details and a **Play** button. Filters: **Date Filter**, **Users**, **User Groups**, and **Sessions fewer than** *(threshold for inclusion)*.
 ## Troubleshooting
When dashboards are generated with large amounts of (or no) session data, you may see errors like:
* **There is too much data to process.**
* **There is no data for the selected time range.**
* **The request timed out. Could not get the data for the "\" dashboard.**
To resolve:
1. Narrow the data range in the filter settings.
2. Increase the timeout in the `EkranServer.Settings.config` file by editing the `DashboardCommandTimeout` key:
```xml EkranServer.Settings.config theme={"system"}
```
The default is `120000` (milliseconds). The file is in `C:\Program Files\Ekran System\Ekran System\Server` on the Application Server host.
Many of these dashboards are similar to the BI report templates you can build by [importing data into Power BI with the Syteca API Data Connector](/docs/api/data-connector/power-bi-example). Consider building a Power BI report for analyses that need to go beyond what the in-product dashboards offer.
## Related
Storage, CPU, memory, database, and Client status.
Tamper-evident record of administrator actions in the Management Tool.
Open from any "Play" button in a dashboard.
Scheduled and ad-hoc reports for offline analysis.
## Troubleshooting
When dashboards are generated with large amounts of (or no) session data, you may see errors like:
* **There is too much data to process.**
* **There is no data for the selected time range.**
* **The request timed out. Could not get the data for the "\" dashboard.**
To resolve:
1. Narrow the data range in the filter settings.
2. Increase the timeout in the `EkranServer.Settings.config` file by editing the `DashboardCommandTimeout` key:
```xml EkranServer.Settings.config theme={"system"}
```
The default is `120000` (milliseconds). The file is in `C:\Program Files\Ekran System\Ekran System\Server` on the Application Server host.
Many of these dashboards are similar to the BI report templates you can build by [importing data into Power BI with the Syteca API Data Connector](/docs/api/data-connector/power-bi-example). Consider building a Power BI report for analyses that need to go beyond what the in-product dashboards offer.
## Related
Storage, CPU, memory, database, and Client status.
Tamper-evident record of administrator actions in the Management Tool.
Open from any "Play" button in a dashboard.
Scheduled and ad-hoc reports for offline analysis.