> ## Documentation Index
> Fetch the complete documentation index at: https://syteca.com/docs/llms.txt
> Use this file to discover all available pages before exploring further.
# The Metadata Grid
> The Metadata grid pane in the Syteca Session Viewer — column reference per OS, search/filter/sort inside a session, and Synced vs Filtered playback modes.
The **Metadata grid** is the right-hand pane of the [Session Viewer](/docs/session-monitoring/player/overview). Every activity recorded in the session — every screen capture, keystroke, clipboard operation, USB event, alert, and command — appears as a row in this grid, synchronized with the Session Player on the left. This page is the reference for the grid's columns (which differ by Client OS), the search/filter/sort tools, and the two playback modes (Synced vs Filtered) that change how the player responds to grid actions.
For the Session Viewer overall — the three-pane layout, playback controls, magnifier, live mode, and bookmarking — see [the Session Viewer overview](/docs/session-monitoring/player/overview).
## Columns per Client OS
The columns shown in the grid depend on the OS the session was recorded from. Every OS has the **Activity Time** column; the rest varies:
| Column | Shows |
| -------------------- | ------------------------------------------------------------------------------------------------------------------------------------------------------------------------------ |
| **Activity Time** | When the activity was recorded. |
| **Activity Title** | The name of the active window associated with the recorded activity. |
| **Application Name** | The application opened on the Client computer. |
| **URL** | The top and second-level domain of the website visited. |
| **Text Data** | The clipboard operation (Copy/Cut/Paste) and data, or the file monitoring operation (file upload) and path. |
| **Alert/USB Rule** | The name of the alert or USB rule triggered. A colored bar on the left of the record indicates the risk level: **red** for Critical, **orange** for High, **blue** for Normal. |
| Column | Shows |
| -------------------- | ------------------------------------------------------------------------------------------------------------------------ |
| **Activity Time** | When the activity was recorded. |
| **Activity Title** | The name of the active window associated with the recorded activity. |
| **Application Name** | The application opened on the Client computer. |
| **URL** | The top and second-level domain of the website visited. |
| **Text Data** | The clipboard operation (Copy/Cut/Paste) and data, or the file monitoring operation (file upload) and path. |
| **Alert/USB Rule** | The name of the alert triggered. A colored bar on the left of the record indicates the risk level (red / orange / blue). |
| Column | Shows |
| ------------------------------------------ | ------------------------------------------------------------------------------------------------------------------------------------------------------------------------------ |
| **Activity Time** | When the command was executed. |
| **Activity Title** *(local X Window only)* | The name of the active window associated with the recorded activity. |
| **Application Name** | The application opened (or the command executed in local X Window sessions). |
| **Command** *(remote SSH only)* | The command executed. |
| **Action** | The action performed, system function call executed, or the word `input` if [User Input Monitoring](/docs/session-monitoring/recording/keystroke-logging#linux-clients) is enabled. |
| **Parameters** | The parameters of the executed command, plus all keystroke inputs if User Input Monitoring is enabled. |
| **Alert** | The name of the alert triggered. A colored bar on the left indicates the risk level (red / orange / blue). |
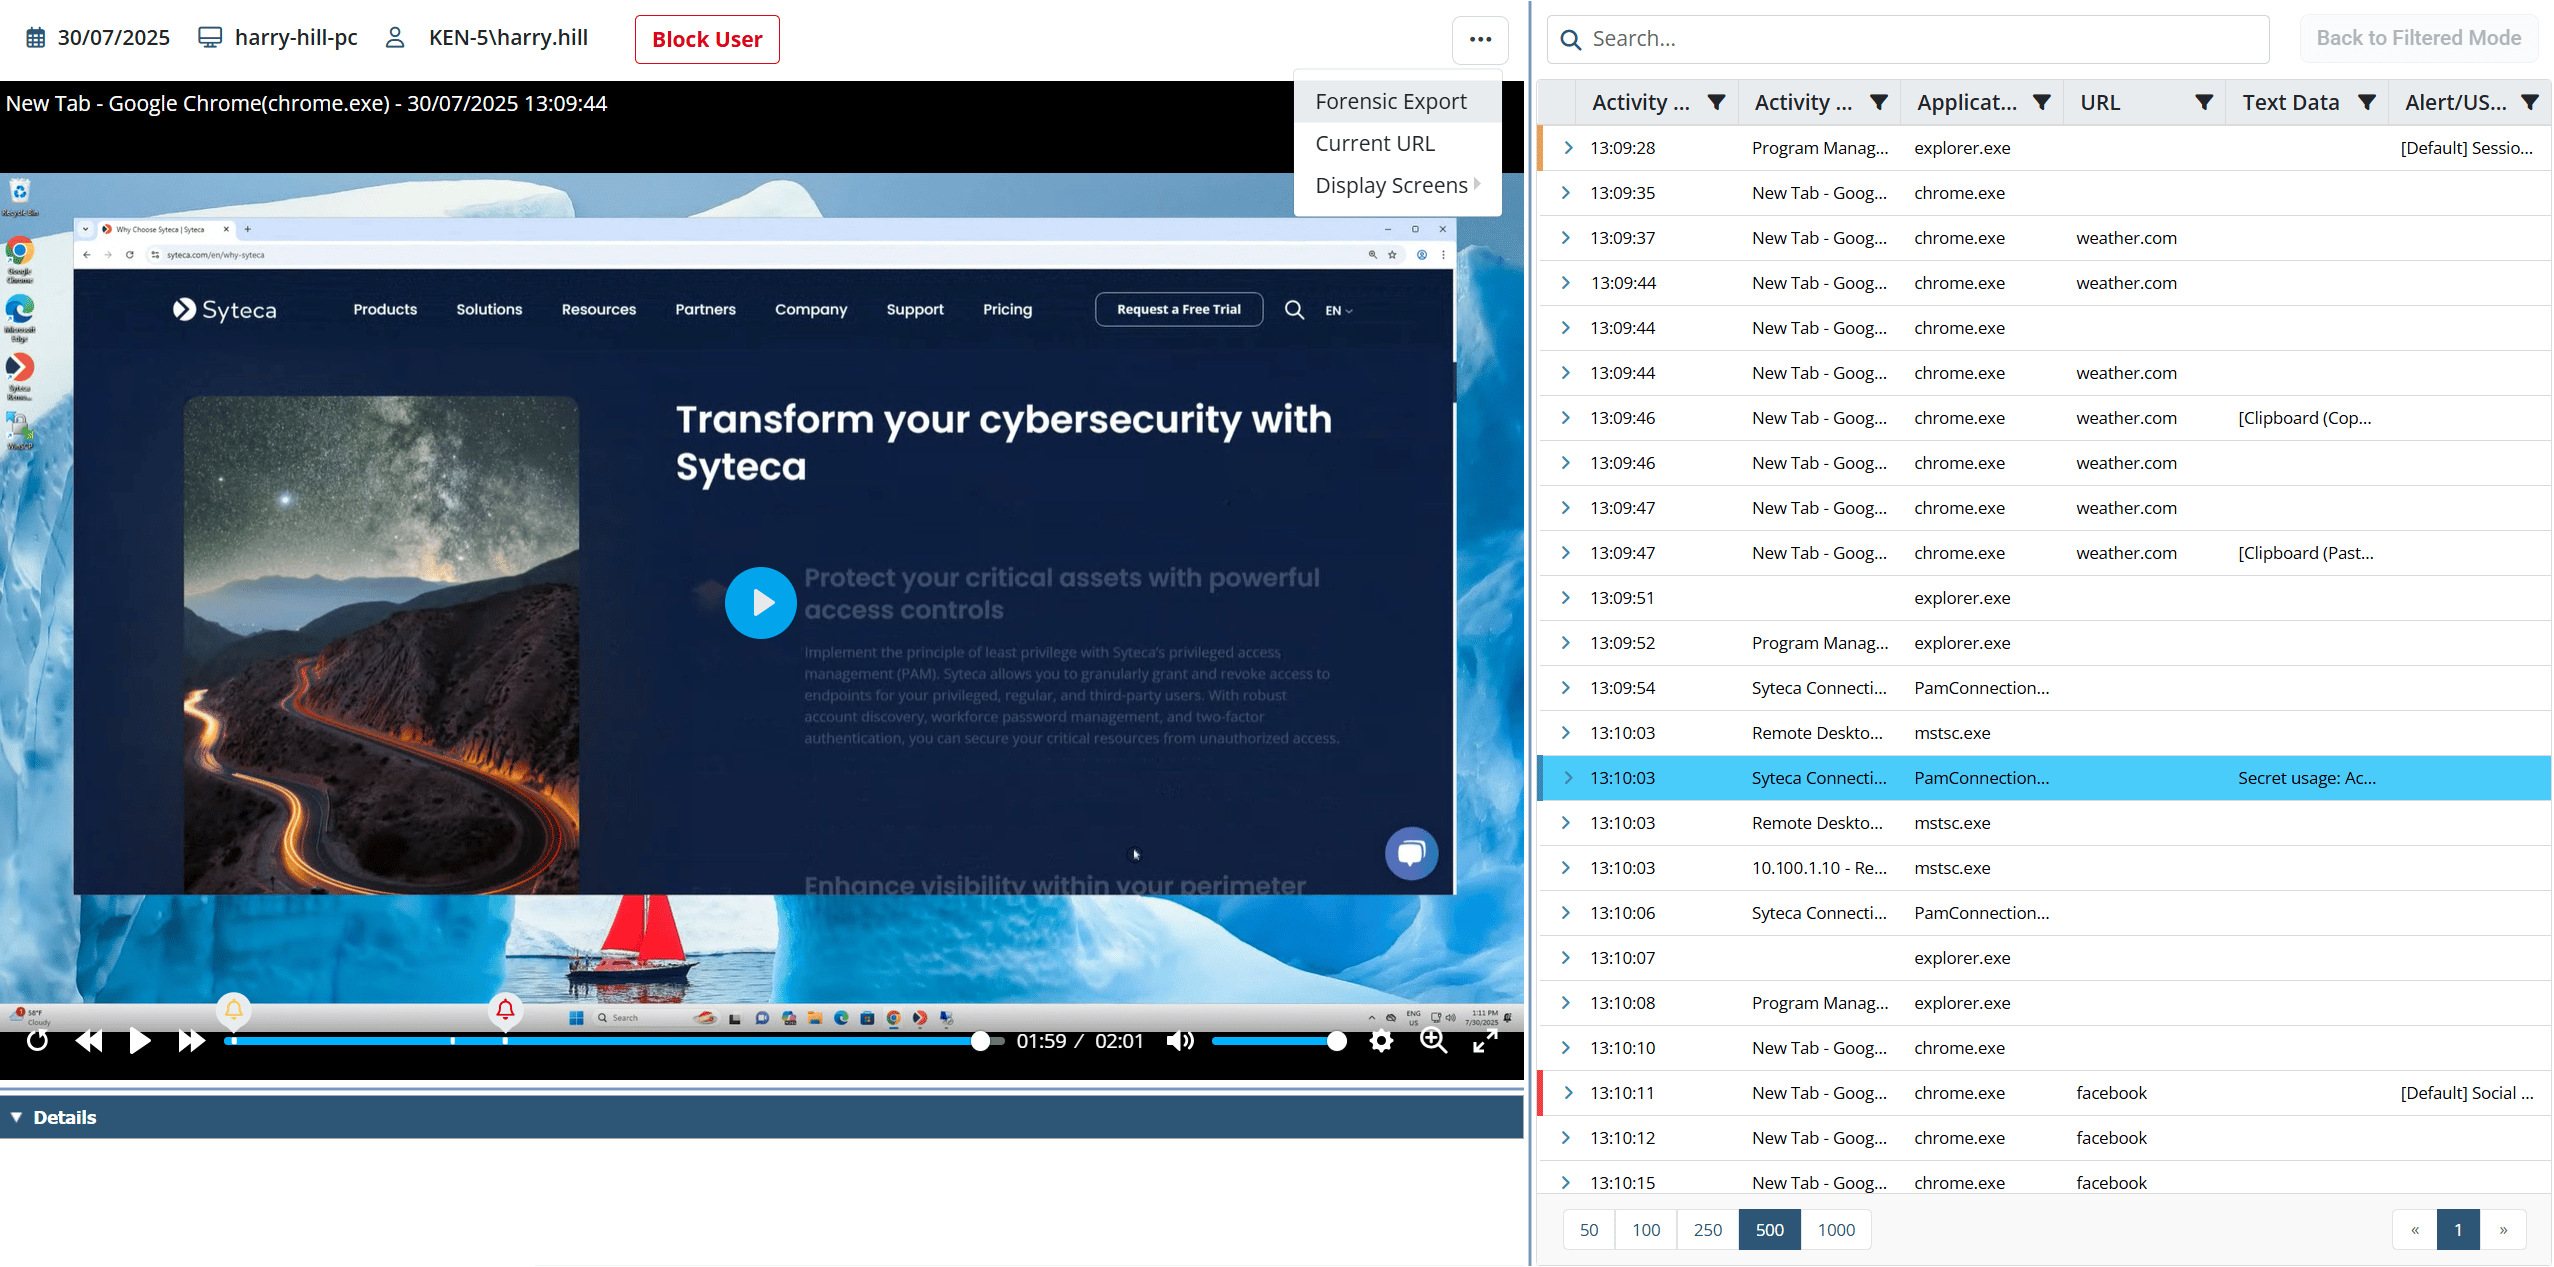 Data is sorted by **Activity Time** by default. Drag column boundaries to resize columns; drag column headers to reorder them.
## Navigate records with the keyboard
When the Session Viewer has focus, the keyboard can navigate between records in the grid:
| Key | Action |
| -------------------------------- | ------------------------------------------------ |
| **Up Arrow** / **Down Arrow** | Previous / next record |
| **Left Arrow** / **Right Arrow** | Previous / next record containing an alert event |
The Previous/Next buttons in the Session Player do the same thing.
Switching between records actually means switching between **screen captures**. Since each record may contain multiple captures (and some may contain none), the keyboard arrows won't always change the visible record — they always change the visible capture. Records without captures are skipped.
## Search, filter, and sort inside a session
The search and filter functions narrow the records visible in the grid — useful for jumping straight to specific moments in a long session ("when did the user open this URL?", "show only records with clipboard data").
As soon as you search, filter, or sort the grid, the Session Player switches from **Synced Mode** to **Filtered Mode** (see [Synced vs Filtered Mode](#synced-vs-filtered-mode) below). Click **Back to Synced Mode** at the top right to clear all search/filter/sort and re-sync. Then **Back to Filtered Mode** restores your last filtered state.
### Search
Enter a keyword in the **Search** box at the top of the Metadata grid. The grid dynamically filters as you type. The search covers these fields:
* Activity Title
* Application Name
* Keystrokes
* Clipboard text data
* USB device info
* URL
* Linux commands
* Linux command parameters
* Linux function calls
For Linux remote SSH sessions, additional search options are available on the grid's Search button — including **Search in output** for searching inside command output, and toggles to show function calls, only execution commands, or user input keystrokes. See [Linux SSH and terminal sessions](/docs/session-monitoring/player/per-os-playback#linux-ssh-and-local-terminal-sessions).
### Filter by column
Click the **Filter** icon in any column header and select the values to keep. Multiple columns can be filtered simultaneously — apply filters one column at a time.
### Sort
Click a column header to sort by that column. Click again to reverse the sort direction. The sort arrow on the header indicates the current direction.
If a column can't be sorted, the sort arrow doesn't appear when you click the header.
## Synced vs Filtered Mode
The Session Player has two operating modes that determine whether the player and grid stay synchronized.
| Mode | Behavior |
| ---------------------------------------------- | -------------------------------------------------------------------------------------------------------------------------------------------------------------------------------------------------------------------------------------------------------------- |
| **Synced Mode** *(default)* | When you play the session, the record corresponding to the screen capture currently being viewed is highlighted in the grid. When you click a record in the grid, the player jumps to that moment. |
| **Filtered Mode** *(after search/filter/sort)* | Player and grid are not synchronized. The player still shows every screen capture in the session, even though the grid only shows the filtered subset. Useful when you want to scrub through the full session while keeping a filtered list of records nearby. |
When you open a session, the player starts in **Synced Mode**. The first search, filter, or sort switches it to **Filtered Mode**. To return to Synced Mode (and clear all search/filter/sort), click the **Back to Synced Mode** button at the top right of the grid.
## Related
The three-pane layout, playback controls, magnifier, live mode, and bookmarking.
What's specific to Windows, macOS, and Linux session playback.
Find the session you want before opening it in the Viewer.
The alert events that show as colored bars in the grid.
Data is sorted by **Activity Time** by default. Drag column boundaries to resize columns; drag column headers to reorder them.
## Navigate records with the keyboard
When the Session Viewer has focus, the keyboard can navigate between records in the grid:
| Key | Action |
| -------------------------------- | ------------------------------------------------ |
| **Up Arrow** / **Down Arrow** | Previous / next record |
| **Left Arrow** / **Right Arrow** | Previous / next record containing an alert event |
The Previous/Next buttons in the Session Player do the same thing.
Switching between records actually means switching between **screen captures**. Since each record may contain multiple captures (and some may contain none), the keyboard arrows won't always change the visible record — they always change the visible capture. Records without captures are skipped.
## Search, filter, and sort inside a session
The search and filter functions narrow the records visible in the grid — useful for jumping straight to specific moments in a long session ("when did the user open this URL?", "show only records with clipboard data").
As soon as you search, filter, or sort the grid, the Session Player switches from **Synced Mode** to **Filtered Mode** (see [Synced vs Filtered Mode](#synced-vs-filtered-mode) below). Click **Back to Synced Mode** at the top right to clear all search/filter/sort and re-sync. Then **Back to Filtered Mode** restores your last filtered state.
### Search
Enter a keyword in the **Search** box at the top of the Metadata grid. The grid dynamically filters as you type. The search covers these fields:
* Activity Title
* Application Name
* Keystrokes
* Clipboard text data
* USB device info
* URL
* Linux commands
* Linux command parameters
* Linux function calls
For Linux remote SSH sessions, additional search options are available on the grid's Search button — including **Search in output** for searching inside command output, and toggles to show function calls, only execution commands, or user input keystrokes. See [Linux SSH and terminal sessions](/docs/session-monitoring/player/per-os-playback#linux-ssh-and-local-terminal-sessions).
### Filter by column
Click the **Filter** icon in any column header and select the values to keep. Multiple columns can be filtered simultaneously — apply filters one column at a time.
### Sort
Click a column header to sort by that column. Click again to reverse the sort direction. The sort arrow on the header indicates the current direction.
If a column can't be sorted, the sort arrow doesn't appear when you click the header.
## Synced vs Filtered Mode
The Session Player has two operating modes that determine whether the player and grid stay synchronized.
| Mode | Behavior |
| ---------------------------------------------- | -------------------------------------------------------------------------------------------------------------------------------------------------------------------------------------------------------------------------------------------------------------- |
| **Synced Mode** *(default)* | When you play the session, the record corresponding to the screen capture currently being viewed is highlighted in the grid. When you click a record in the grid, the player jumps to that moment. |
| **Filtered Mode** *(after search/filter/sort)* | Player and grid are not synchronized. The player still shows every screen capture in the session, even though the grid only shows the filtered subset. Useful when you want to scrub through the full session while keeping a filtered list of records nearby. |
When you open a session, the player starts in **Synced Mode**. The first search, filter, or sort switches it to **Filtered Mode**. To return to Synced Mode (and clear all search/filter/sort), click the **Back to Synced Mode** button at the top right of the grid.
## Related
The three-pane layout, playback controls, magnifier, live mode, and bookmarking.
What's specific to Windows, macOS, and Linux session playback.
Find the session you want before opening it in the Viewer.
The alert events that show as colored bars in the grid.