> ## Documentation Index
> Fetch the complete documentation index at: https://syteca.com/docs/llms.txt
> Use this file to discover all available pages before exploring further.
# Bandwidth Usage Reduction Parameters
> Reduce the volume of data a Windows Client sends to the Application Server by throttling screen captures, batching transmissions, and tuning compression.
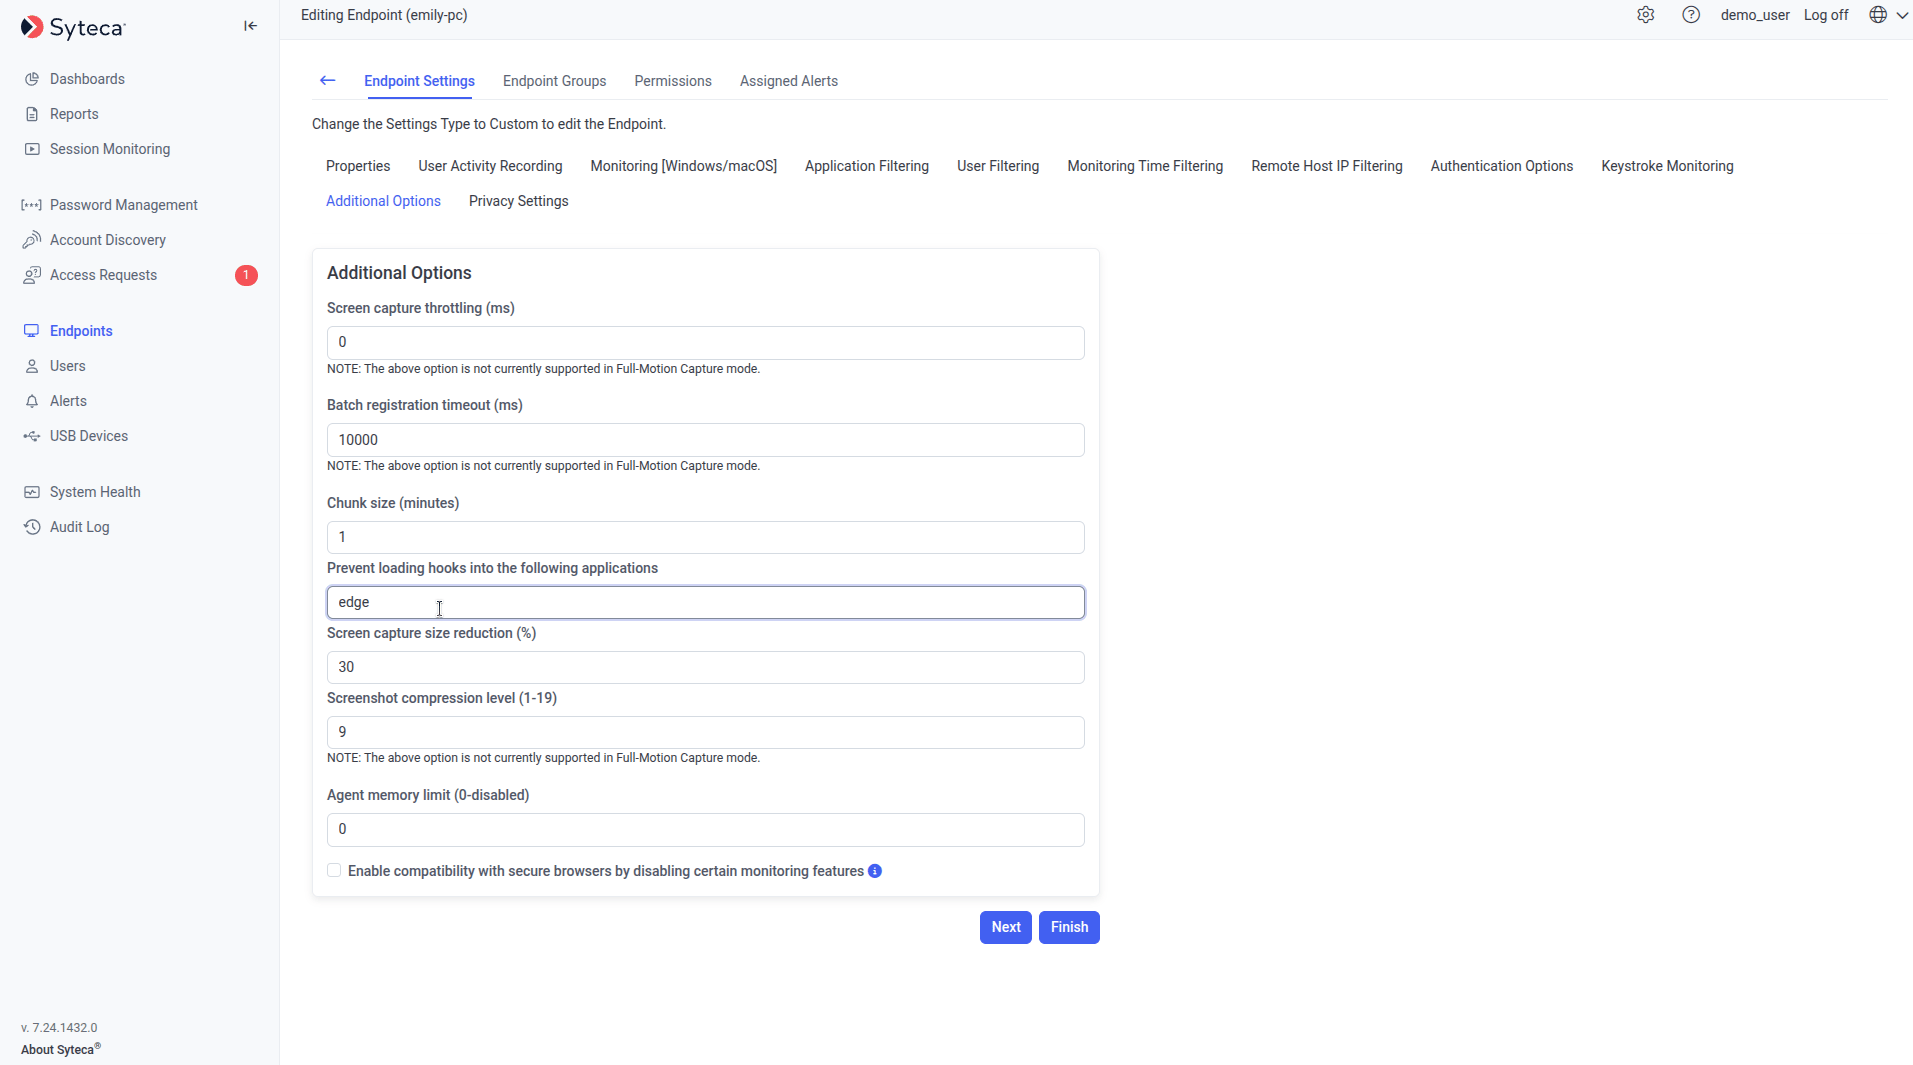
Applies to Windows Clients only. Configure these on the **Editing Client** / **Editing Client Group** page, **Additional Options** tab.
These parameters reduce the amount of data a Client records and sends to the Application Server - useful for reducing bandwidth usage, database growth, or Client-side resource consumption.
## Screen capture throttling (ms)
Limits how frequently screen captures are recorded within a session. For example, a value of `2000` records at most one screen capture every 2 seconds. `0` (the default) applies no limit - captures follow the configured [user activity recording parameters](/docs/session-monitoring/recording/user-activity-recording) with no throttling.
| Screen capture throttling (ms) | Traffic (24-bit captures, one session) |
| ------------------------------ | -------------------------------------- |
| 0 | \~27 kb/s |
| 2000 | \~7 kb/s |
In this example, throttling reduces bandwidth usage by roughly 75%.
Screen captures tied to alert events are always recorded, regardless of this setting. When viewing a live session, captures update at the throttled frequency. Not supported in Full-Motion Capture mode.
## Batch registration timeout (ms)
Controls how often batched monitoring data is sent to the Application Server, instead of sending each activity record immediately. Default: `10000` ms. Maximum for terminal servers: `1000` ms.
Not supported in Full-Motion Capture mode.
## Chunk size (minutes)
Sets the duration of each video segment before it's sent to the Application Server. Range: 1–10 minutes, default 1 minute.
Not supported in Interval Capture mode.
## Prevent loading hooks into the following applications
Excludes specific applications from Client hook injection (used for file upload, keystroke, and RDP connection monitoring, among others) - useful if an application has performance issues or crashes because of it. Enter process names as shown in Task Manager, without file extensions, separated by semicolons (for example `WINWORD;EXCEL`).
## Reduce screen capture size by (%)
Shrinks recorded screen captures by the specified percentage before sending them, trading image quality for size. Default: `30`, which balances readable quality against database growth.
Screen captures already recorded aren't affected retroactively. Doesn't apply when [Capture active window only](/docs/session-monitoring/recording/user-activity-recording) is enabled, or in Full-Motion Capture mode.
## Screen capture compression level (1–19)
Controls compression applied to screen captures before sending. `19` is maximum compression (least disk space, more CPU on the Client). `1` is minimum compression (more disk space, less CPU).
Not supported in Full-Motion Capture mode.
## Agent memory limit (0 = disabled)
Not yet implemented - this option can't currently be used.
Intended to cap the memory used by the Client service process, sending monitored data to the Application Server more frequently to compensate.
## Support secure browsers by disabling some monitoring features
Disables some Client hooks to allow secure browsers to function. Trade-off: some monitoring features stop working correctly - detecting certain file upload operations, keystrokes in RDP sessions, active window switching, monitoring language/layout changes, and keystrokes using Polish diacritical characters.
 ## Example: multiple high-resolution monitors
To avoid performance issues on Client computers with multiple 2K/4K displays:
* **Reduce screen capture size by (%)**: `15`
* **Screen capture compression level (1-19)**: `5`
## Related
Configure when and how activity is recorded.
Another lever for managing Client-side data volume.
Full Windows Client installation and configuration reference.
## Example: multiple high-resolution monitors
To avoid performance issues on Client computers with multiple 2K/4K displays:
* **Reduce screen capture size by (%)**: `15`
* **Screen capture compression level (1-19)**: `5`
## Related
Configure when and how activity is recorded.
Another lever for managing Client-side data volume.
Full Windows Client installation and configuration reference.