> ## Documentation Index
> Fetch the complete documentation index at: https://syteca.com/docs/llms.txt
> Use this file to discover all available pages before exploring further.
# Reports
> Syteca reports turn recorded user activity into evidence — 28+ report types covering productivity, alerts, USB events, sessions, and audits, scheduled or ad-hoc.
## Turn months of activity data into one email-ready PDF
Recording everything is useful. Proving what happened is what auditors, executives, HR, and incident responders actually ask for — and they ask in PDF or Excel form, on a schedule, broken down by user, application, or time window. A monitoring platform that captures every keystroke but makes you SQL the database to answer "what did Sarah do last Tuesday between 2 and 4 PM" is a platform that fails the moment the compliance team shows up.
Tools at one end of the market (free auditd, raw syslog) leave you to write your own reporting layer.Other tools at the other end ship rich reports but pin you to their canned categories and SaaS branding. **Syteca reports** sit in between — 28+ report types ready out of the box, scheduled delivery to any email address, custom header / footer / logo to match your organization, export to PDF, Excel, CSV, HTML, RTF, plain text, or XML, and role-based download permissions so the right people see the right reports.
**Use Syteca reports when you need to:**
* Produce **compliance evidence** for SOC 2, ISO 27001, PCI DSS, HIPAA, or NIST 800-53 audits — session viewing logs, access requests, USB events, secondary authentication.
* Send **weekly or monthly user productivity summaries** to managers without manual extraction work.
* Surface **alerts and outside-of-work-hours activity** to security teams as a recurring email digest.
* Build **monthly executive dashboards** of clipboard, file upload, URL, and application usage across the organization.
* Track **who has viewed which recorded sessions** (auditing the auditors).
* Investigate **specific incidents** by generating ad-hoc reports filtered to one user and time window.
**Pair it with [User Activity Dashboards](/docs/session-monitoring/dashboards/user-activity-dashboards)** — dashboards are for live exploration in the Management Tool, reports are for evidence you save, send, or print.
This page is the conceptual overview, the full report-type reference, and the customization and report-management settings that apply across all reports. To actually generate reports, see [Ad-hoc reports](/docs/session-monitoring/reports/ad-hoc-reports) (one-time) and [Scheduled reports](/docs/session-monitoring/reports/scheduled-reports) (recurring).
## Export formats
Every report type can be generated in any of the following formats:
| Format | Best for |
| --------------------------------------------------------- | ---------------------------------------------------------- |
| **PDF** (`.pdf`) | Auditor packages, executive sharing, archival evidence |
| **Excel Workbook** (`.xlsx`) / **Excel 97-2003** (`.xls`) | Spreadsheet analysis, pivot tables, further filtering |
| **CSV** (`.csv`) | Importing into BI tools, data warehouses, custom pipelines |
| **HTML** (`.html`) / **Single File Web Page** (`.mht`) | Sharing via browser, embedding in dashboards |
| **Rich Text Format** (`.rtf`) / **Plain Text** (`.txt`) | Email body, lightweight sharing |
| **XPS Document** (`.xps`) | Microsoft-native fixed-layout archival |
| **XML** (`.xml`) | Machine processing, ETL pipelines |
To view **Japanese characters** in exported PDF reports, the **Arial Unicode MS** font must be installed on both the Application Server and the Management Tool computers — and both must be rebooted afterward. After that, new reports will render Japanese correctly.
## Report types
The Management Tool offers 28+ report types organized into three categories: **Grid Reports** (tabular data), **Summary Grid Reports** (aggregations), and **Chart Reports** (visualizations). Where a report only works on certain Client OSs, that's noted next to its name.
"(Grouped)" report types contain the same data as their non-grouped counterparts, but combine all per-user / per-Client groups into a single grid — useful when exporting to Excel for pivot tables and cross-Client analysis.
### Grid Reports
| Report type | Contains | Key columns |
| -------------------------------------------------------------- | -------------------------------------------------------------------------------------------------------------------------------------- | ---------------------------------------------------------------------------------------------------------------------------------------------------- |
| **Access Request Grid** | All access requests with status, when processed, who processed them | Client Name, User Name, Request Type, Requested At, Status, Processed At, Processed By, Expired At |
| **Alert Grid** | All alert events detected | Activity Time, Alert Name, Alert Risk, Details |
| **Audit Session Grid** *(User Management permission required)* | Which Management Tool users viewed which sessions, based on the same records that appear in the [Audit Log](/docs/administration/audit-log) | Date & Time, Viewer User Name/Group, Action, Who, Where, Session Time |
| **Clipboard Grid** *(Windows / macOS)* | All clipboard text operations performed by users | Activity Time, Activity Title, Application, Clipboard Operation, Clipboard Text |
| **Clipboard Grid (Grouped)** *(Windows / macOS)* | Same as Clipboard Grid, single grid by Client / User | Client Name, User Name, then Clipboard Grid columns |
| **Detailed Activity Grid** | All user activities | Activity Time, Activity Title, Application, URL, Text Data |
| **Detailed Activity Grid (Grouped)** | Same as Detailed Activity Grid, single grid | Client Name, User Name, then Detailed Activity Grid columns |
| **File Monitoring Grid** *(Windows / macOS)* | All file upload operations detected | Risk Level, Time, Process Name, Path, File Name, Operation, Details |
| **Keystroke Grid** *(Windows / macOS)* | All keystrokes entered by users | Activity Time, Activity Title, Application, Keystrokes (Smart), Keystrokes (Raw) |
| **Linux/XWindow Grid** *(Linux only)* | All `exec*` and `sudo` commands executed | Activity Time, Command, Function, Parameters |
| **Overtime Work Grid** | Time spent outside specified standard work hours, idle excluded *(time after login until first activity excluded — see note below)* | User Name, Total Time Spent, Active Out Of Work Hours, Session Start, Last Activity, Remote IP, Remote Public IP, Session URL |
| **Secondary User Authentication Grid** | All logins to Clients using secondary authentication | Client Name, IP Address, User Name, Secondary Auth Login, Login Time, Remote IPv4, Remote Host Name |
| **Session Grid** | All sessions | User Name, Total Time, Active Time, Session Start, Last Activity, Remote IP, Remote Public IP, Session URL, Comment |
| **Session Grid (Grouped)** | Same as Session Grid, single grid by Client | Client Name + Session Grid columns |
| **Session Viewing Status Grid** | Which users have viewed which Client sessions, and which sessions have not been viewed | Session ID, User Name, Client Name, Session Start, Last Activity, Remote IP, Remote Public IP, Session URL, Is Viewed, Viewer User Name, Date & Time |
| **Sessions Outside of Work Hours Grid** | Like Overtime Work Grid, but **includes** time after login until first activity recorded | User Name, Total Time Spent, Active Out Of Work Hours, Session Start, Last Activity, Remote IP, Remote Public IP, Session URL |
| **Terminal Server Grid** *(Windows only)* | All users who connected to Terminal Server Clients | Client Name, Number Of Users, User Name, Number Of Connections, Total Time |
| **USB Alert Grid** *(Windows / macOS)* | All USB events detected by [USB monitoring rules](/docs/session-monitoring/usb-devices/usb-rules) | Time, Rule Name, Action (Blocked/Allowed), Risk Level, Device Class, Device Details |
| **USB Storage Grid** *(Windows only)* | All USB devices plugged in and automatically detected (no rule required) | Time, Details |
| **User Behavior Analytics Grid** *(not in SaaS)* | All sessions with user behavior anomalies detected | Who, Where, When, Details, Session Score, Session URL |
| **User Daily Activity Grid** | Activity of users by day, idle excluded | User Name, Active Time, First Activity Time, Last Activity Time, Remote IP, Remote Public IP, Session URL |
| **User Statistics Grid** | Total activity of users | User Name, Total Time Spent, Session Count, Computers, Remote IPs, Remote Public IPs |
### Summary Grid Reports
| Report type | Contains | Key columns |
| -------------------------------------------------- | ---------------------------------------------------------------- | ---------------------------------------------------------------------------------------------------------- |
| **Activity Summary Grid** | Total time using each application, **idle included** | Application Name, % Of Time, Time Spent |
| **Activity Summary Grid (Grouped)** | Same as Activity Summary Grid, single grid by Client / User | Client Name, User Name, Activity Date, Application Name, Minutes Spent |
| **URL Summary Grid** *(Windows / macOS)* | Total time on each website | URL, % Of Time, Time Spent |
| **URL Summary Grid (Grouped)** *(Windows / macOS)* | Same as URL Summary Grid, single grid by Client / User | Client Name, User Name, Activity Date, URL, Minutes Spent |
| **User Productivity Summary Grid** | Total time spent by user + top 10 applications + top 10 websites | User Name, Date, Total Time, Active Time, First/Last Activity, Idle Time, Top 10 Applications, Top 10 URLs |
### Chart Reports
| Report type | Visualization |
| ---------------------------------------- | ---------------------------------------------------------------------- |
| **Activity Chart** | Bar chart of Activity Summary Grid data |
| **Activity Pie Chart** | Pie chart of Activity Summary Grid data |
| **URL Chart** *(Windows / macOS)* | Bar chart of URL Summary Grid data (URL host only, e.g. `example.com`) |
| **URL Pie Chart** *(Windows / macOS)* | Pie chart of URL Summary Grid data |
| **User Active Time and Idle Time Chart** | Bar chart of active vs idle time per user |
| **User Productivity Chart** | Bar chart of active time per hour per day per user, idle excluded |
| **User Productivity Heatmap** | Heatmap of active time per hour per day per user, idle excluded |
## The Generated Reports tab
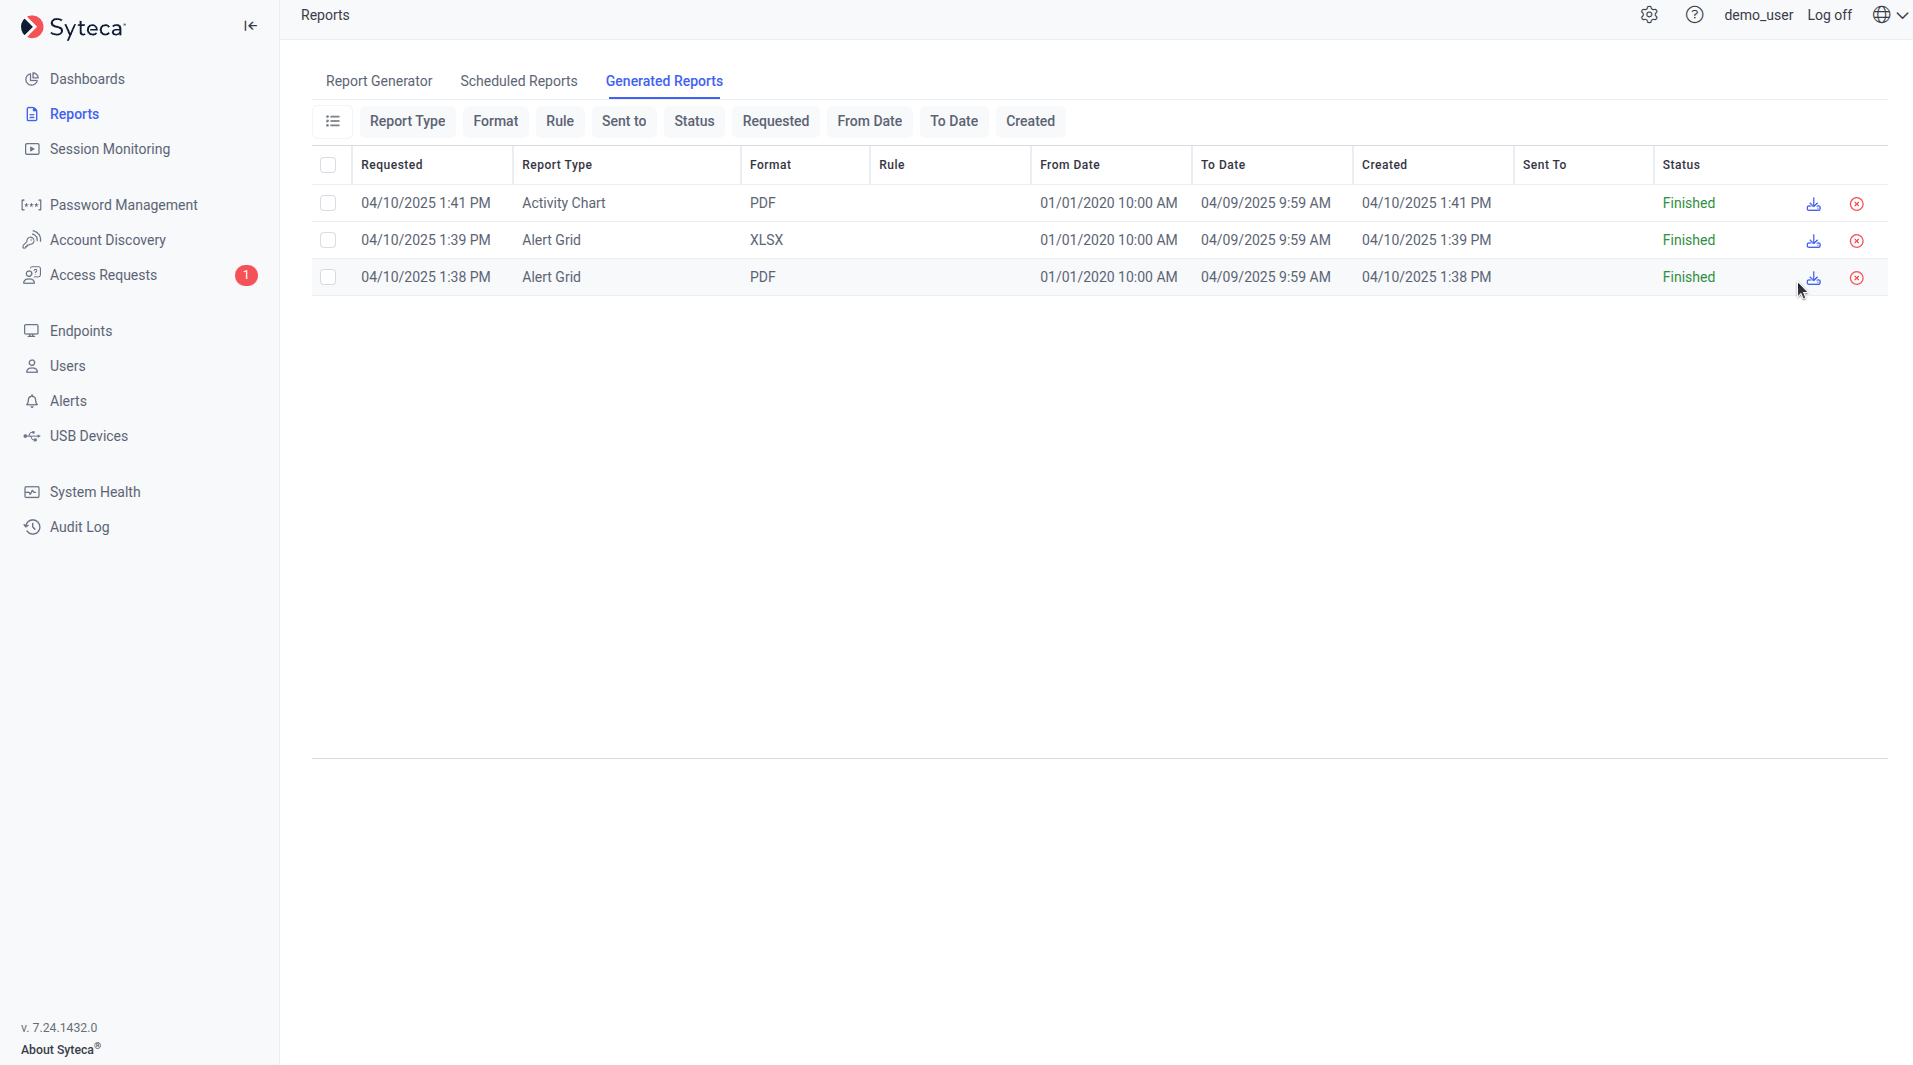 Both ad-hoc reports and scheduled reports send their output to the **Generated Reports** tab on the **Reports** page. The grid shows every report that's been requested, including the in-progress ones, with these columns:
| Column | Shows |
| ------------------------------ | ----------------------------------------------------------------------- |
| **Select** *(checkbox)* | Select one row, or click the column-header checkbox to select all. |
| **Requested** | When the report was requested. |
| **Report Type** | The type of report (Alert Grid, Activity Chart, etc.). |
| **Format** | PDF, CSV, XLSX, etc. |
| **Rule** | Name of the Scheduled Report rule used. Empty for ad-hoc reports. |
| **From Date** / **To Date** | Time period covered. |
| **Created** | When generation finished. |
| **Sent To** | Email addresses the report was sent to (scheduled reports only). |
| **Status** | **Queued**, **In Progress**, **Finished**, **Failed**, or **Canceled**. |
| **Download** *(icon)* | Download the generated report. |
| **Cancel and remove** *(icon)* | Cancel an in-progress report or delete a record. |
The **Download** icon is only shown to users allowed to download the report (per the "Who can download" setting at generation time) and who have the [administrative Viewing Monitoring Results permission](/docs/administration/users/administrative-permissions).
Select multiple report rows with the checkboxes and use **Bulk Action → Cancel and remove** to clean up the grid. To cancel a Queued or In Progress report without removing the record, cancel it on the [Tasks List](/docs/administration/dashboards/system-health-dashboards#tasks-list) tab of the System Health page instead — the row stays in the Generated Reports grid with status "Canceled."
The grid refreshes every 60 seconds — press **F5** for an immediate refresh.
In Multi-Tenant mode, users only see reports for their own tenant.
## Customize report branding
Set a custom header, footer, and logo so every report carries your organization's branding instead of the Syteca default. The setting applies to **all** reports for **all** users.
Click the **Configuration** button at the top of the Management Tool, then select the **Customization** tab.
In the **Custom Reports Settings** section, enter the required text in the **Header Text** and **Footer Text** fields.
Still in **Custom Reports Settings**, select **Use a custom logo instead of the Syteca logo**, click **Choose File**, and pick your logo image. The custom logo appears on the first page of every report.
Click **Save** at the bottom of the page.
## Related
The Report Generator — one-time reports for any time period.
Recurring reports emailed automatically — daily, weekly, monthly.
Live, interactive views for exploration (reports are for evidence).
The administrator-action log surfaced in the Audit Session Grid report.
Both ad-hoc reports and scheduled reports send their output to the **Generated Reports** tab on the **Reports** page. The grid shows every report that's been requested, including the in-progress ones, with these columns:
| Column | Shows |
| ------------------------------ | ----------------------------------------------------------------------- |
| **Select** *(checkbox)* | Select one row, or click the column-header checkbox to select all. |
| **Requested** | When the report was requested. |
| **Report Type** | The type of report (Alert Grid, Activity Chart, etc.). |
| **Format** | PDF, CSV, XLSX, etc. |
| **Rule** | Name of the Scheduled Report rule used. Empty for ad-hoc reports. |
| **From Date** / **To Date** | Time period covered. |
| **Created** | When generation finished. |
| **Sent To** | Email addresses the report was sent to (scheduled reports only). |
| **Status** | **Queued**, **In Progress**, **Finished**, **Failed**, or **Canceled**. |
| **Download** *(icon)* | Download the generated report. |
| **Cancel and remove** *(icon)* | Cancel an in-progress report or delete a record. |
The **Download** icon is only shown to users allowed to download the report (per the "Who can download" setting at generation time) and who have the [administrative Viewing Monitoring Results permission](/docs/administration/users/administrative-permissions).
Select multiple report rows with the checkboxes and use **Bulk Action → Cancel and remove** to clean up the grid. To cancel a Queued or In Progress report without removing the record, cancel it on the [Tasks List](/docs/administration/dashboards/system-health-dashboards#tasks-list) tab of the System Health page instead — the row stays in the Generated Reports grid with status "Canceled."
The grid refreshes every 60 seconds — press **F5** for an immediate refresh.
In Multi-Tenant mode, users only see reports for their own tenant.
## Customize report branding
Set a custom header, footer, and logo so every report carries your organization's branding instead of the Syteca default. The setting applies to **all** reports for **all** users.
Click the **Configuration** button at the top of the Management Tool, then select the **Customization** tab.
In the **Custom Reports Settings** section, enter the required text in the **Header Text** and **Footer Text** fields.
Still in **Custom Reports Settings**, select **Use a custom logo instead of the Syteca logo**, click **Choose File**, and pick your logo image. The custom logo appears on the first page of every report.
Click **Save** at the bottom of the page.
## Related
The Report Generator — one-time reports for any time period.
Recurring reports emailed automatically — daily, weekly, monthly.
Live, interactive views for exploration (reports are for evidence).
The administrator-action log surfaced in the Audit Session Grid report.