> ## Documentation Index
> Fetch the complete documentation index at: https://syteca.com/docs/llms.txt
> Use this file to discover all available pages before exploring further.
# The Sessions List
> Find any recorded session quickly: filter, search keystrokes and clipboard text, sort, and bulk-act on Syteca Client sessions from the Activity Monitoring page.
Every monitored session a Syteca Client records appears on the **Client Sessions** tab of the **Activity Monitoring** page. With deployments of any real size, the question isn't *whether* you have the data - it's how to find the specific session you need in a list of thousands. This page covers how the session list is organized, every filter and search mode available, and the bulk actions you can run on selected sessions.
For playing back a session once you've found it, see [The Session Viewer](/docs/session-monitoring/player/overview).
Viewing the Activity Monitoring page requires the [Viewing Monitoring Results administrative permission](/docs/administration/users/administrative-permissions), plus the [Viewing Monitoring Results Client permission](/docs/administration/users/client-permissions) for each specific Client whose sessions you need to see.
## How sessions are organized
Monitored data from Windows, macOS, and Linux Clients is grouped into sessions. The data and lifecycle vary slightly by OS:
| Client OS | Session contains | When a new session starts |
| ------------------------------- | ---------------------------------------------------------------------------------------------- | ----------------------------------------------------------------------------------------------------------------------------------- |
| **Windows / macOS** | Screen captures or video, application names, activity titles, keystrokes, clipboard text, URLs | Every user login or computer restart |
| **Linux SSH / local terminal** | Commands executed (with parameters), function calls, system responses | Every SSH terminal opened |
| **Linux GUI (X Window System)** | Screen captures, application names, activity titles, activity times | Every login (or computer restart) |
| **Linux X-forwarded** | Screen captures and commands together | Started as child of the parent SSH session - see [the playback notes for X-forwarded sessions](/docs/session-monitoring/player/overview) |
In every case, the **maximum duration of one session is 24 hours**. At 00:00 (midnight), all live sessions terminate, change from **Live** to **Finished**, and new live sessions start automatically. The two halves remain linked in the Session Player so you can navigate between them.
### When are new sessions started?
By default, a session starts automatically as soon as any user logs in to a Client machine, and ends automatically when they log out.
Sessions still active at midnight are also terminated automatically at that point. What happens next depends on the Client's operating system:
| Client OS | Terminated at midnight? | New session starts | Idle event carried into new session? |
| ----------- | ----------------------- | ------------------------------------------------------ | ---------------------------------------------- |
| **Windows** | Yes | Immediately after midnight, automatically. | Yes - the same idle event is registered again. |
| **macOS** | Yes | As soon as the user performs an action after midnight. | No |
| **Linux** | Yes | As soon as the user performs an action after midnight. | No |
If an idle event was already registered before midnight and the user still hasn't acted by midnight, that same idle event carries into the new session once it starts (Windows only - see the table above).
**Example:** 5 users are logged in to 5 different Client computers. In 2 of those sessions the user has taken at least one action; in the other 3, no action has occurred since login. At midnight, all 5 sessions end automatically. The 2 active ones restart immediately regardless of OS. The 3 inactive ones restart immediately only on Windows - on macOS and Linux, those 3 don't start a new session until the user performs an action.
Automated system tasks (like a background script) don't count as user actions and aren't recorded. On Windows and macOS, an idle event still registers during a period with no user action, even if the system runs an automated task during that time.
If [monitoring filters](/docs/session-monitoring/recording/filtering) are configured (application, user, time, IP, or keystroke filtering), sessions still start normally - the filter only controls whether activity within the session gets recorded.
## Open the Sessions List
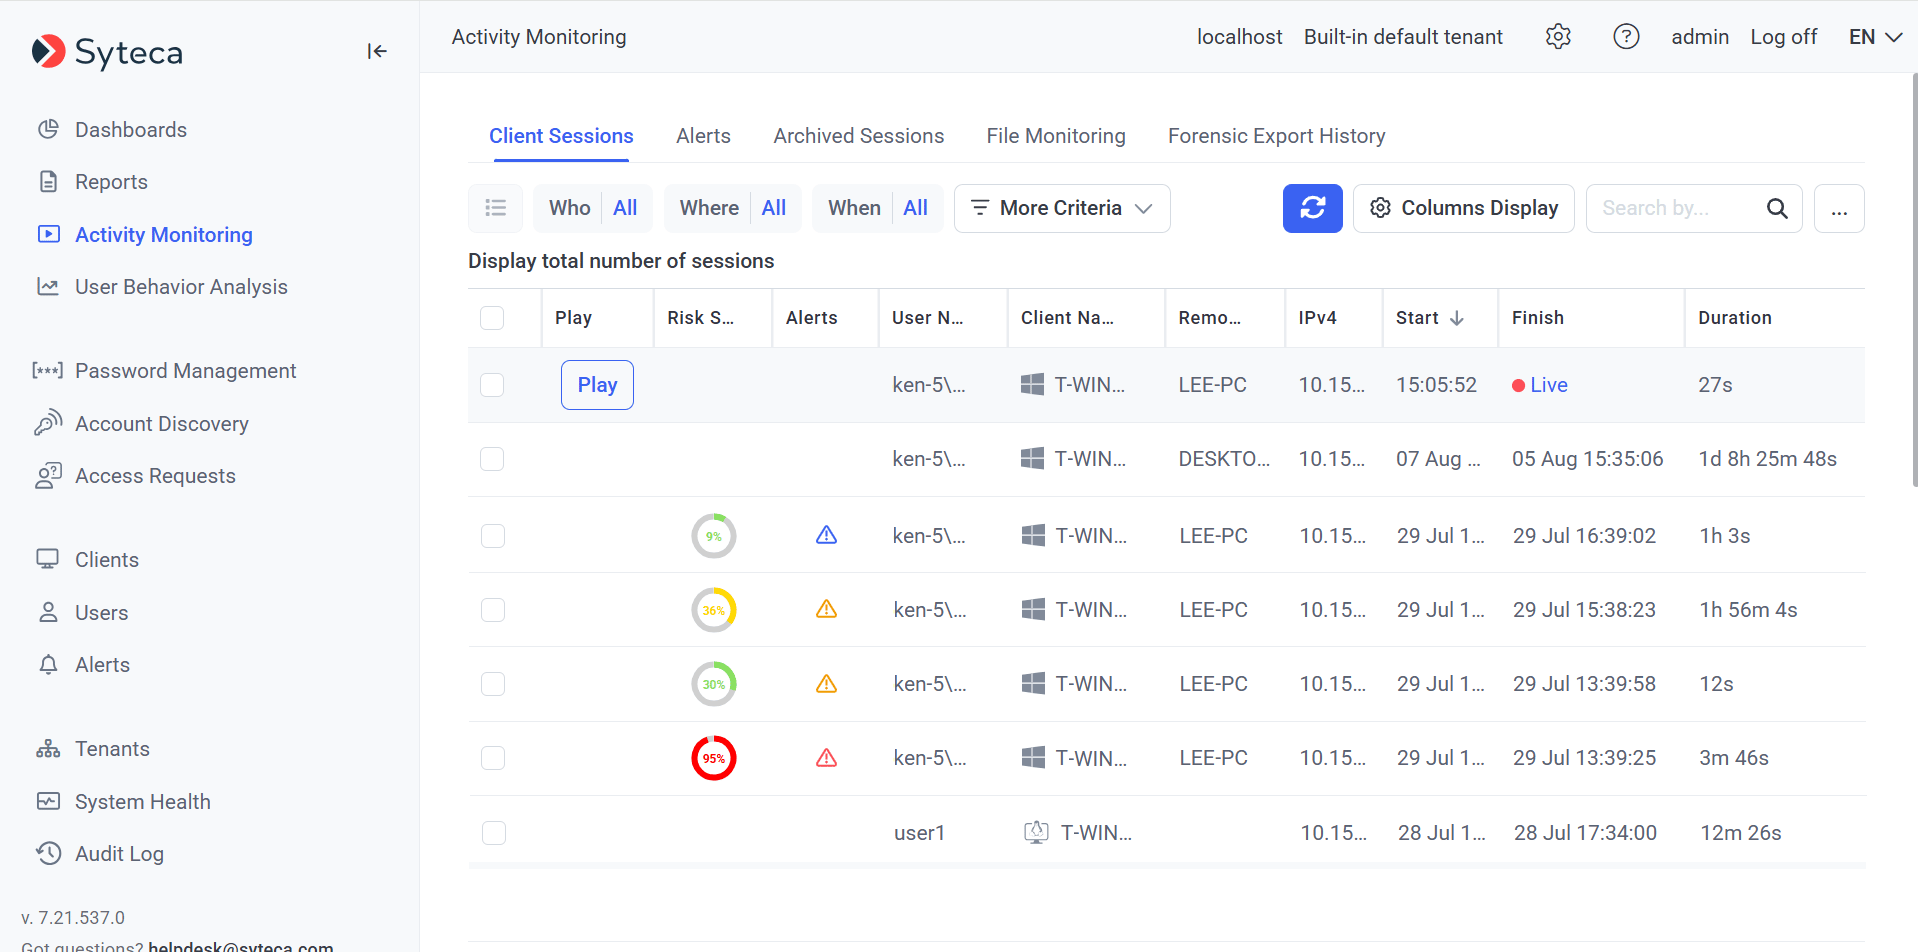 Sign in to the Management Tool and click **Activity Monitoring** in the left navigation. The **Client Sessions** tab is selected by default.
The total number of sessions matching the current filters appears at the top. The grid below shows each session with these default columns:
| Column | Shows |
| ----------------------------- | ---------------------------------------------------------------------------------------------------------------------------------------------------------------------------------------------------------------------------- |
| *(checkbox)* | Select sessions for [Bulk Action](#bulk-action). |
| **Play** | The Play icon opens the session in the [Session Viewer](/docs/session-monitoring/player/overview). Double-clicking the row also plays it. |
| **Alerts** | A colored icon if [alerts](/docs/session-monitoring/alerts) or [USB monitoring rule](/docs/session-monitoring/usb-devices/usb-rules) events triggered in the session - **red** for Critical, **orange** for High, **blue** for Normal. |
| **User Name** | The user logged into the Client. If [secondary user authentication](/docs/administration/access/two-factor-authentication) or [one-time passwords](/docs/pam/secrets/password-checkout) are in use, both names appear. |
| **Client Name** | The Client computer's name, with an OS icon to the left. |
| **Remote Host Name** | The name of the remote computer that connected to the Client. |
| **IP** *(toggle IPv4 / IPv6)* | The Client computer's IP address. |
| **Start** | When the session started. |
| **Finish** | When the session finished - or a Live icon if still in progress. |
| **Duration** | Total session duration. |
Click any column header to sort by it. The **up/down arrow** indicates current sort order; click again to reverse. Only one column can be the sort key at a time. Columns where data can't be sorted don't show the arrow.
Drag column boundaries left or right to resize columns. Use **Results on Page** in the bottom right to change how many sessions appear per page. Click **Refresh** in the top right to re-pull from the database without changing your filters.
### Add or hide columns
Click **Column Display** at the top of the page to open the **Manage Columns** pop-up. Select checkboxes to add columns, deselect to hide, drag with the up/down arrows to reorder.
Beyond the defaults, these columns are available:
| Column | Shows |
| ----------------------------- | ---------------------------------------------------------------------------------------------------------------------------------------------------------------------------------------------------------------------------------------------- |
| **Risk Score** | Severity icon for the session - click to open the [Session Risk Score](/docs/session-monitoring/ueba/overview#abnormal-sessions) page with the UEBA anomalies and alerts detected. **Red** for Critical, **orange** for High, **green** for Normal. |
| **Last Activity** | Date and time of the last screen capture or Linux command. |
| **Remote IPv4 / IPv6** | The local IPv4/IPv6 address of the remote computer. |
| **Remote Public IPv4 / IPv6** | The public IPv4/IPv6 address of the remote computer. |
| **Domain** | The Client's domain. |
| **Description** | Custom Client description. |
| **User's Comments** | The user's comment entered on login. For Linux X-forwarded sessions, this shows `x-forwarded app:` followed by the application name. |
| **Client Groups** | The groups the Client belongs to. Empty if the Client only belongs to the All Clients group. |
| **Time Zone** | The Client's time zone in UTC. Changing time zone ends the current session and starts a new one. Empty for sessions recorded before the current Syteca version. |
If the user logs into a Client computer remotely **after** the Client session already started using DameWare, Radmin, UltraVNC, or TightVNC, the remote IP address can't be detected.
## Filter sessions
Sign in to the Management Tool and click **Activity Monitoring** in the left navigation. The **Client Sessions** tab is selected by default.
The total number of sessions matching the current filters appears at the top. The grid below shows each session with these default columns:
| Column | Shows |
| ----------------------------- | ---------------------------------------------------------------------------------------------------------------------------------------------------------------------------------------------------------------------------- |
| *(checkbox)* | Select sessions for [Bulk Action](#bulk-action). |
| **Play** | The Play icon opens the session in the [Session Viewer](/docs/session-monitoring/player/overview). Double-clicking the row also plays it. |
| **Alerts** | A colored icon if [alerts](/docs/session-monitoring/alerts) or [USB monitoring rule](/docs/session-monitoring/usb-devices/usb-rules) events triggered in the session - **red** for Critical, **orange** for High, **blue** for Normal. |
| **User Name** | The user logged into the Client. If [secondary user authentication](/docs/administration/access/two-factor-authentication) or [one-time passwords](/docs/pam/secrets/password-checkout) are in use, both names appear. |
| **Client Name** | The Client computer's name, with an OS icon to the left. |
| **Remote Host Name** | The name of the remote computer that connected to the Client. |
| **IP** *(toggle IPv4 / IPv6)* | The Client computer's IP address. |
| **Start** | When the session started. |
| **Finish** | When the session finished - or a Live icon if still in progress. |
| **Duration** | Total session duration. |
Click any column header to sort by it. The **up/down arrow** indicates current sort order; click again to reverse. Only one column can be the sort key at a time. Columns where data can't be sorted don't show the arrow.
Drag column boundaries left or right to resize columns. Use **Results on Page** in the bottom right to change how many sessions appear per page. Click **Refresh** in the top right to re-pull from the database without changing your filters.
### Add or hide columns
Click **Column Display** at the top of the page to open the **Manage Columns** pop-up. Select checkboxes to add columns, deselect to hide, drag with the up/down arrows to reorder.
Beyond the defaults, these columns are available:
| Column | Shows |
| ----------------------------- | ---------------------------------------------------------------------------------------------------------------------------------------------------------------------------------------------------------------------------------------------- |
| **Risk Score** | Severity icon for the session - click to open the [Session Risk Score](/docs/session-monitoring/ueba/overview#abnormal-sessions) page with the UEBA anomalies and alerts detected. **Red** for Critical, **orange** for High, **green** for Normal. |
| **Last Activity** | Date and time of the last screen capture or Linux command. |
| **Remote IPv4 / IPv6** | The local IPv4/IPv6 address of the remote computer. |
| **Remote Public IPv4 / IPv6** | The public IPv4/IPv6 address of the remote computer. |
| **Domain** | The Client's domain. |
| **Description** | Custom Client description. |
| **User's Comments** | The user's comment entered on login. For Linux X-forwarded sessions, this shows `x-forwarded app:` followed by the application name. |
| **Client Groups** | The groups the Client belongs to. Empty if the Client only belongs to the All Clients group. |
| **Time Zone** | The Client's time zone in UTC. Changing time zone ends the current session and starts a new one. Empty for sessions recorded before the current Syteca version. |
If the user logs into a Client computer remotely **after** the Client session already started using DameWare, Radmin, UltraVNC, or TightVNC, the remote IP address can't be detected.
## Filter sessions
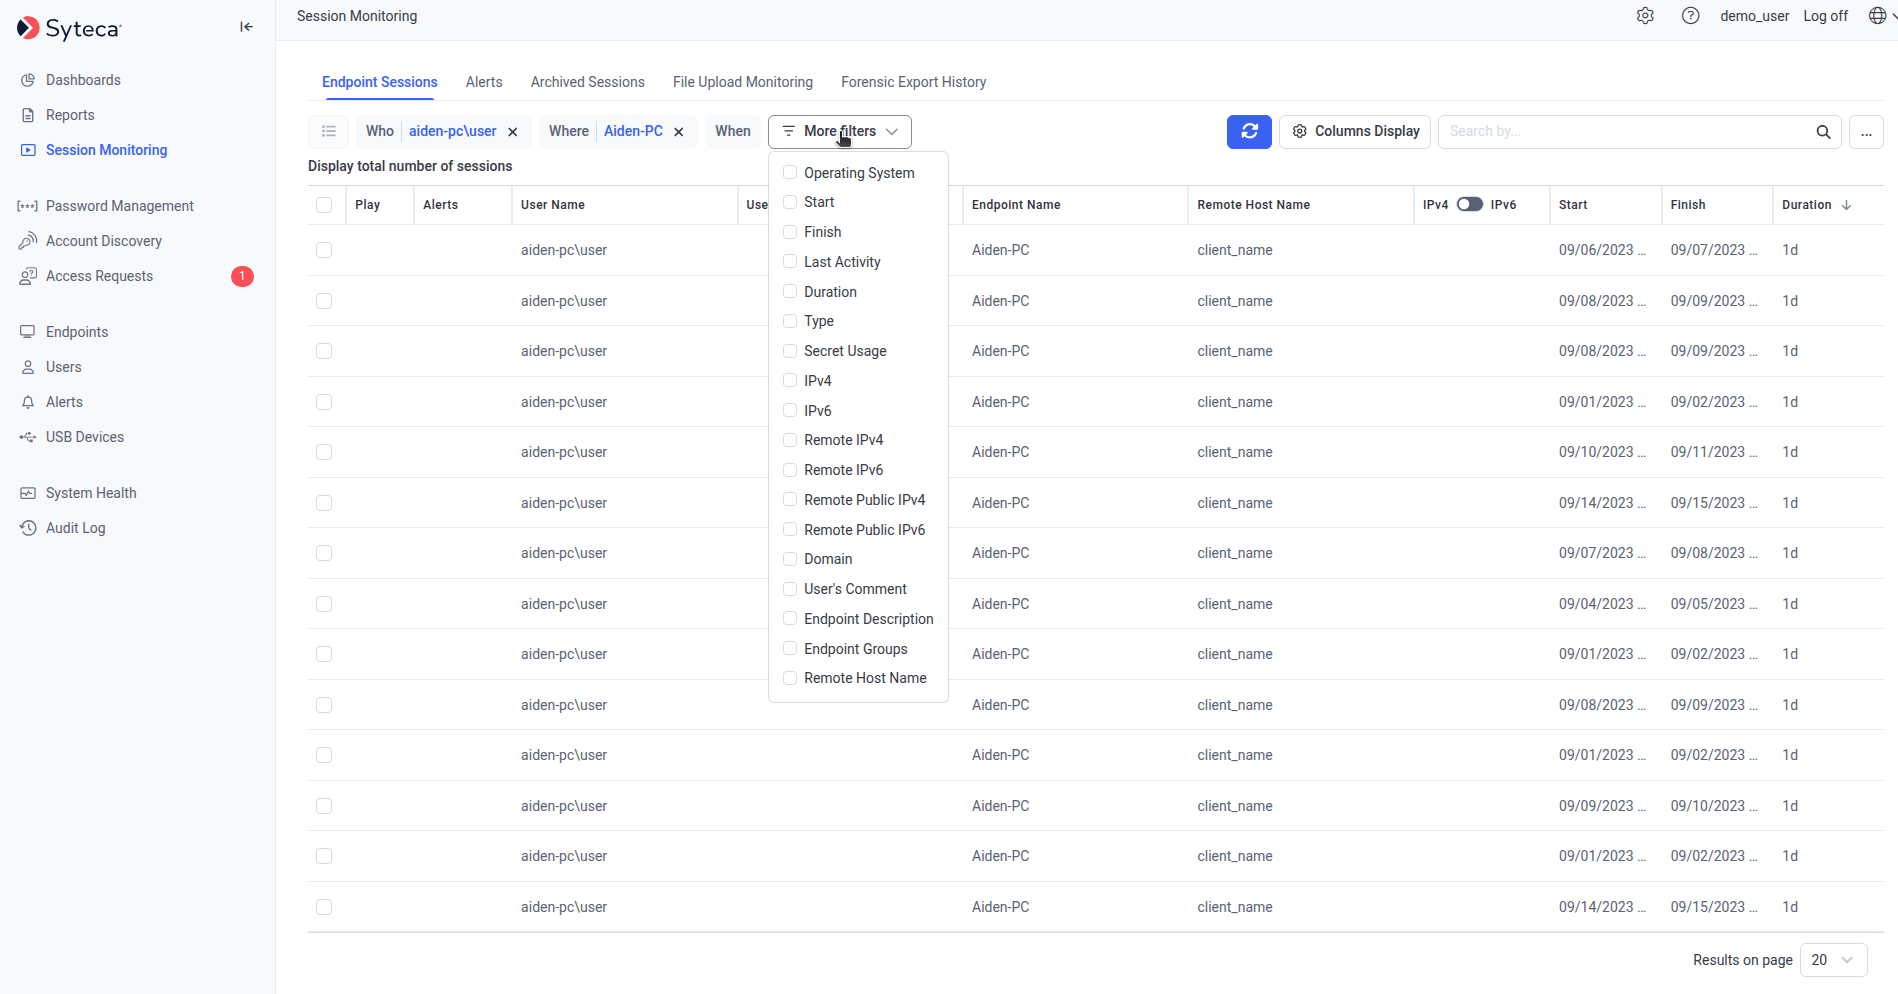 Filters narrow the list to sessions matching specific criteria. Multiple filters can be applied simultaneously, and within each filter (except **When**), multiple values can be selected - the list re-filters with each parameter you add.
### Default filters
| Filter | Filters by |
| --------- | --------------------------------------------------------------------------------------------------------------------------------------------- |
| **Who** | A specific user logged into a Client. |
| **Where** | A specific Client. |
| **When** | A time period - either **Within the last** N hours/days/weeks/months, or **Between** specific start and end dates. Click **Apply** to commit. |
The **Who** filter defaults to displaying the first **1,500 session records**. To raise this, add the `SessionsFilteredByUserMaxCount` key to the `EkranServer.Settings.config` file on the Application Server, for example:
```xml theme={"system"}
```
The config file lives in `C:\Program Files\Ekran System\Ekran System\Server`. **In SaaS**, this file isn't accessible - contact your Syteca vendor or the Syteca Support team to change the default.
### Additional filters
Click **More criteria** to add any of these:
| Filter | Filters by |
| -------------------------------------------------- | -------------------------------------------------------------------------------------- |
| **Operating System** | Linux Desktop, Linux X forwarded, Linux/Unix Terminal, macOS, or Windows. |
| **Start** | Session start date and time. |
| **Finish** | Session finish date and time. Empty for Live sessions. |
| **Last Activity** | Date and time of the last screen capture or Linux command. |
| **Duration** | Total session duration. Empty for Live sessions. |
| **Type** | **Live** or **Finished**. |
| **Secret Usage** | Names of [secrets](/docs/pam/secrets/use-secrets) used during the user's session. |
| **IPv4 / IPv6** | Client computer's IP address. |
| **Remote IPv4 / IPv6 / Remote Public IPv4 / IPv6** | The remote computer's local or public IP address. |
| **Domain** | The Client's domain. |
| **User's Comments** | Comment entered on login, including `x-forwarded app:` for Linux X-forwarded sessions. |
| **Client Description** | The Client's custom description. |
| **Client Groups** | Client groups the Client belongs to. |
| **Remote Host Name** | The remote host computer's name. |
To remove an additional filter, click the **X** next to its button. The default Who / Where / When filters always remain.
## Search inside session content
The **Search by** box in the top right searches across multiple data types - not just session metadata, but the actual content recorded. The default search covers:
* Application names
* Activity titles
* URLs
* Linux commands and parameters
* Alert names
* USB rule names
To extend the search into more sensitive content, click the **...** button next to the **Search by** field and enable the relevant options:
| Option | Adds to search |
| ---------------------------- | ---------------------------------------------------------------------------------- |
| **Search keystrokes data** | Keystrokes from Windows and macOS sessions. |
| **Search clipboard data** | Clipboard text from copy/paste operations. |
| **Search in output (Linux)** | Linux command output - only shown if at least one Linux session has been recorded. |
Use **Search in First** N sessions (10, 100, 500, 1000, or all) on the same `...` menu to limit search scope. Searching keystrokes across all sessions can be slow on large deployments - start with a smaller scope and widen if needed.
### Search using a list of keywords
For investigations involving many search terms (a list of compromised account names, a list of regulated URLs, a list of forbidden commands), upload a keyword file:
Create a `.txt` file with one keyword per line (or separated by spaces).
Click the **...** button next to the **Search by** field, then **Browse keywords**, and select the file.
Click the **Search** icon. Results appear in the session list.
Searching large keyword lists across many sessions can take considerable time and impact Application Server performance - consider narrowing the session list with filters first, or using **Search in First** to bound the scope.
## Bulk Action
Select one or more sessions with their checkboxes (or use **Select All** in the column header), then click **Bulk Action** in the top left for these options:
| Option | What it does |
| -------------------- | --------------------------------------------------------------------------------------------------------------------------------------------- |
| **Export to CSV** | Export the selected session list to a CSV file. See [Exporting Client Sessions to a CSV File](/docs/session-monitoring/forensic-export). |
| **Forensic Export** | Perform a [Forensic Export](/docs/session-monitoring/forensic-export) of the selected sessions - produces evidence packages for legal proceedings. |
| **Cleanup Sessions** | Delete the selected sessions from the database. |
Only the **Cleanup** operation is available through Bulk Action - not the broader [Archive & Cleanup](/docs/administration/database/compare-databases) operation, which is configured per-Client.
## Related
Play back a session once you've found it - three panes, magnifier, live mode, bookmarking.
The alert events that show as colored icons in the Alerts column.
The behavior anomaly risk scores in the Risk Score column.
How the list looks when Pseudonymizer is enabled - randomized aliases, hidden columns, Expose Requests.
Filters narrow the list to sessions matching specific criteria. Multiple filters can be applied simultaneously, and within each filter (except **When**), multiple values can be selected - the list re-filters with each parameter you add.
### Default filters
| Filter | Filters by |
| --------- | --------------------------------------------------------------------------------------------------------------------------------------------- |
| **Who** | A specific user logged into a Client. |
| **Where** | A specific Client. |
| **When** | A time period - either **Within the last** N hours/days/weeks/months, or **Between** specific start and end dates. Click **Apply** to commit. |
The **Who** filter defaults to displaying the first **1,500 session records**. To raise this, add the `SessionsFilteredByUserMaxCount` key to the `EkranServer.Settings.config` file on the Application Server, for example:
```xml theme={"system"}
```
The config file lives in `C:\Program Files\Ekran System\Ekran System\Server`. **In SaaS**, this file isn't accessible - contact your Syteca vendor or the Syteca Support team to change the default.
### Additional filters
Click **More criteria** to add any of these:
| Filter | Filters by |
| -------------------------------------------------- | -------------------------------------------------------------------------------------- |
| **Operating System** | Linux Desktop, Linux X forwarded, Linux/Unix Terminal, macOS, or Windows. |
| **Start** | Session start date and time. |
| **Finish** | Session finish date and time. Empty for Live sessions. |
| **Last Activity** | Date and time of the last screen capture or Linux command. |
| **Duration** | Total session duration. Empty for Live sessions. |
| **Type** | **Live** or **Finished**. |
| **Secret Usage** | Names of [secrets](/docs/pam/secrets/use-secrets) used during the user's session. |
| **IPv4 / IPv6** | Client computer's IP address. |
| **Remote IPv4 / IPv6 / Remote Public IPv4 / IPv6** | The remote computer's local or public IP address. |
| **Domain** | The Client's domain. |
| **User's Comments** | Comment entered on login, including `x-forwarded app:` for Linux X-forwarded sessions. |
| **Client Description** | The Client's custom description. |
| **Client Groups** | Client groups the Client belongs to. |
| **Remote Host Name** | The remote host computer's name. |
To remove an additional filter, click the **X** next to its button. The default Who / Where / When filters always remain.
## Search inside session content
The **Search by** box in the top right searches across multiple data types - not just session metadata, but the actual content recorded. The default search covers:
* Application names
* Activity titles
* URLs
* Linux commands and parameters
* Alert names
* USB rule names
To extend the search into more sensitive content, click the **...** button next to the **Search by** field and enable the relevant options:
| Option | Adds to search |
| ---------------------------- | ---------------------------------------------------------------------------------- |
| **Search keystrokes data** | Keystrokes from Windows and macOS sessions. |
| **Search clipboard data** | Clipboard text from copy/paste operations. |
| **Search in output (Linux)** | Linux command output - only shown if at least one Linux session has been recorded. |
Use **Search in First** N sessions (10, 100, 500, 1000, or all) on the same `...` menu to limit search scope. Searching keystrokes across all sessions can be slow on large deployments - start with a smaller scope and widen if needed.
### Search using a list of keywords
For investigations involving many search terms (a list of compromised account names, a list of regulated URLs, a list of forbidden commands), upload a keyword file:
Create a `.txt` file with one keyword per line (or separated by spaces).
Click the **...** button next to the **Search by** field, then **Browse keywords**, and select the file.
Click the **Search** icon. Results appear in the session list.
Searching large keyword lists across many sessions can take considerable time and impact Application Server performance - consider narrowing the session list with filters first, or using **Search in First** to bound the scope.
## Bulk Action
Select one or more sessions with their checkboxes (or use **Select All** in the column header), then click **Bulk Action** in the top left for these options:
| Option | What it does |
| -------------------- | --------------------------------------------------------------------------------------------------------------------------------------------- |
| **Export to CSV** | Export the selected session list to a CSV file. See [Exporting Client Sessions to a CSV File](/docs/session-monitoring/forensic-export). |
| **Forensic Export** | Perform a [Forensic Export](/docs/session-monitoring/forensic-export) of the selected sessions - produces evidence packages for legal proceedings. |
| **Cleanup Sessions** | Delete the selected sessions from the database. |
Only the **Cleanup** operation is available through Bulk Action - not the broader [Archive & Cleanup](/docs/administration/database/compare-databases) operation, which is configured per-Client.
## Related
Play back a session once you've found it - three panes, magnifier, live mode, bookmarking.
The alert events that show as colored icons in the Alerts column.
The behavior anomaly risk scores in the Risk Score column.
How the list looks when Pseudonymizer is enabled - randomized aliases, hidden columns, Expose Requests.