> ## Documentation Index
> Fetch the complete documentation index at: https://syteca.com/docs/llms.txt
> Use this file to discover all available pages before exploring further.
# User Behavior Analysis (UEBA)
> Syteca UEBA: detect insider threats by building per-user behavior baselines and flagging sessions with anomalies — endpoint-native, no separate SIEM required.
## Insider threats look normal — until the baseline says they don't
The hardest threats to detect are the ones that don't look like attacks. A privileged user copying a database export at 11pm on a Saturday isn't doing anything technically forbidden. A contractor accessing a system they normally use during weekday business hours, suddenly at 3am from a different city, isn't tripping any rule. Traditional alerts catch *defined* bad behavior — UEBA catches *deviation from established normal*.
The market answer to this has historically been a separate **UEBA / SIEM product** — Exabeam, Securonix, Splunk UBA, or Microsoft Sentinel — fed by log forwarders, deployed in parallel with whatever you're using for endpoint monitoring. That works, but it adds a second platform, a second skill set, a second budget line, and a second integration to maintain.
**Syteca UEBA** is built into the same platform you're already using for session recording and PAM. It analyzes the user activity your Clients are already capturing, builds **per-user behavior profiles** of normal work patterns, and surfaces **abnormal sessions** with a risk score in the same Session Viewer you already use. No separate platform, no log forwarding, no parallel skill set — just turn on a behavior rule and watch the anomalies appear in the sessions list.
**Use UEBA when you need to:**
* Detect **insider threats** — privileged users acting outside their normal patterns, credential abuse, account compromise where the attacker mimics the legitimate user.
* Surface **shift changes, holiday access, off-hours activity** that might indicate compromised accounts or unauthorized after-hours work.
* Add **behavioral context** to existing alerts — turning "someone logged in at 3am" from a one-line log entry into a session you can review.
* Build **defensible audit evidence** that anomalous user activity is being detected and reviewed, not just recorded.
* Get **UEBA without buying a second product** — useful for organizations where Syteca is already the endpoint monitoring platform.
**Pair it with [Alerts](/docs/session-monitoring/alerts)** — Alerts catch *defined* bad behavior, UEBA catches *deviation from normal*. Together they cover both halves of the detection space.
**Not available in SaaS.** UEBA is only supported on on-premises and self-hosted Syteca deployments. It is also **not available in High Availability mode**.
## How UEBA works in three pieces
UEBA in Syteca is a continuous loop with three moving parts:
1. **User behavior rules** — you define what kinds of anomalies to detect (e.g. unusual work hours) and assign them to specific Clients / Client groups.
2. **User profiles** — for each user on each rule-assigned Client, the system automatically builds a profile of their normal behavior over time, and rebuilds it every 10 days.
3. **Abnormal sessions** — sessions that deviate from the profile get a risk score (Normal / High / Critical), surface in the Client Sessions list, and email notifications go to investigators. You then **Approve** (normal behavior, refine profile) or **Skip** (genuine anomaly, exclude from profile) each one.
The Approve/Skip loop is what makes the system get smarter over time. Every Approve teaches the profile that this pattern is normal for this user; every Skip teaches it that this pattern was an actual anomaly worth noting.
## User behavior rules
User behavior rules live on the **Rules** tab of the **User Behavior Analysis** page. The grid lists every rule with these columns:
| Column | Shows |
| ------------------- | ---------------------------------------------- |
| **Name** | Rule name. |
| **Description** | Optional description. |
| **State** | Whether the rule is enabled. |
| **Assigned to** | Clients and Client groups the rule applies to. |
| **Email Recipient** | Investigators notified about rule events. |
Use the **Search** box at the top to find rules by name or keyword.
All rule operations (add, edit, delete, enable/disable) require the [administrative Client Installation and Management permission](/docs/administration/users/administrative-permissions).
### Add a rule
Click **User Behavior Analysis** in the left navigation, select the **Rules** tab, then click **Add** in the top right.
In the **Properties** section at the top:
* Select **Enable rule**.
* Enter a unique **Name**.
* Optionally enter a **Description**.
In the **Conditions** section, select the **Unusual work hours** checkbox, then choose the risk level (**Normal**, **High**, or **Critical**).
In the **Clients** and **Client Groups** sections, select the Clients and groups to apply the rule to.
Use the **Search** box to find specific Clients or groups by name.
In the **Email Notifications** section, select what you want to be notified about:
* **Send notification on detected anomalies for a finished session** — notify when a session ends with anomalies detected.
* **Send instant notification on detected anomalies** — notify the moment an anomaly is detected during a live session.
* **Send total session risk score in case of no anomalies** — notify when a session ends without anomalies.
Enter recipient addresses in **Send Email Notification To** — multiple addresses are separated by semicolons.
Email notifications require [Email Sending Settings](/docs/administration/configuration/email-sending-settings) to be configured correctly.
In the **Additional Actions** section:
* **Show warning message to user** — display a customizable warning on the user's screen when the rule triggers.
* **Block user in the current session** — automatically block the user when an anomaly is detected.
Click **Finish** in the bottom right. The rule appears on the Rules tab and starts evaluating sessions immediately.
### Edit a rule
On the **Rules** tab, click the **Edit Rule** icon next to the rule.
Edit the rule the same way as when [adding](#add-a-rule) it.
Click **Finish** in the bottom right.
### Enable or disable a rule
To temporarily turn a rule off without losing its configuration, disable it instead of deleting it.
Open the rule with the **Edit Rule** icon. In the **Properties** section, deselect **Enable rule** (or re-select to re-enable). Click **Finish**.
On the **Rules** tab, select the checkbox next to each rule. Click **Bulk Action** in the top left, then choose **Enable** or **Disable**.
### Delete a rule
Open the rule with the **Edit Rule** icon. Click **Delete Rule** in the bottom left of the Edit Rule page, then **Delete** in the confirmation.
On the **Rules** tab, select the checkboxes for the rules. Click **Bulk Action** in the top left, choose **Delete**, then click **Delete** in the confirmation.
Anomalies detected by a rule **before** it was deleted are not deleted — the historical record of detected anomalies is preserved.
## User profiles
A user profile is automatically built for **each user** of **each Client** to which a behavior rule is assigned. The profile captures the user's normal behavior pattern over the monitored time period, and is what the system compares each new session against to decide if it's anomalous.
### The User Profiles list
The **User Profiles** tab on the User Behavior Analysis page lists every profile with these columns:
| Column | Shows |
| ------------------- | -------------------------------------------------------------------------------- |
| **Client Name** | The computer the Client is installed on. |
| **User Name** | The endpoint user the profile is built for. |
| **Actual Date** | The time period the profile covers. |
| **Next Rebuilding** | When the profile will next be automatically rebuilt (by default, every 10 days). |
Only days with **approved user sessions** or **sessions without detected anomalies** count toward profile building. Sessions with unresolved anomalies are excluded until you approve or skip them.
### View a user profile
On the **User Profiles** tab, click anywhere on a profile row to open it.
Profiles still under construction cannot be opened — wait for the initial build to complete.
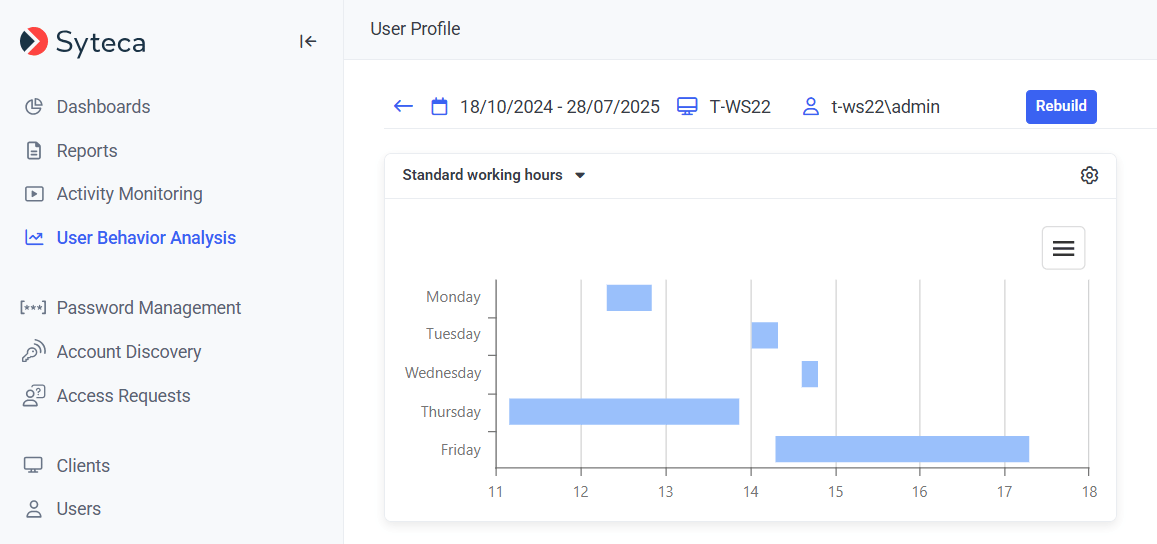
The **User Profile** page displays a bar chart of the user's normal work schedule for the covered time period. Each bar represents one work day; the length of each bar represents the time the user spent at work that day. Click any of the profile entries listed in the grid to drill into the detail for that period.
 ### Rebuild a user profile
User profiles **automatically rebuild every 10 days**, starting daily at midnight. The rebuild incorporates approved sessions and sessions without anomalies that have accumulated since the last build.
To rebuild a profile **manually** — useful after a deliberate behavior change (the user's role changed, they moved to a new shift), or after approving a batch of legitimate-but-previously-flagged sessions — click the **Rebuild** button in the top right of the User Profile page.
## Abnormal sessions
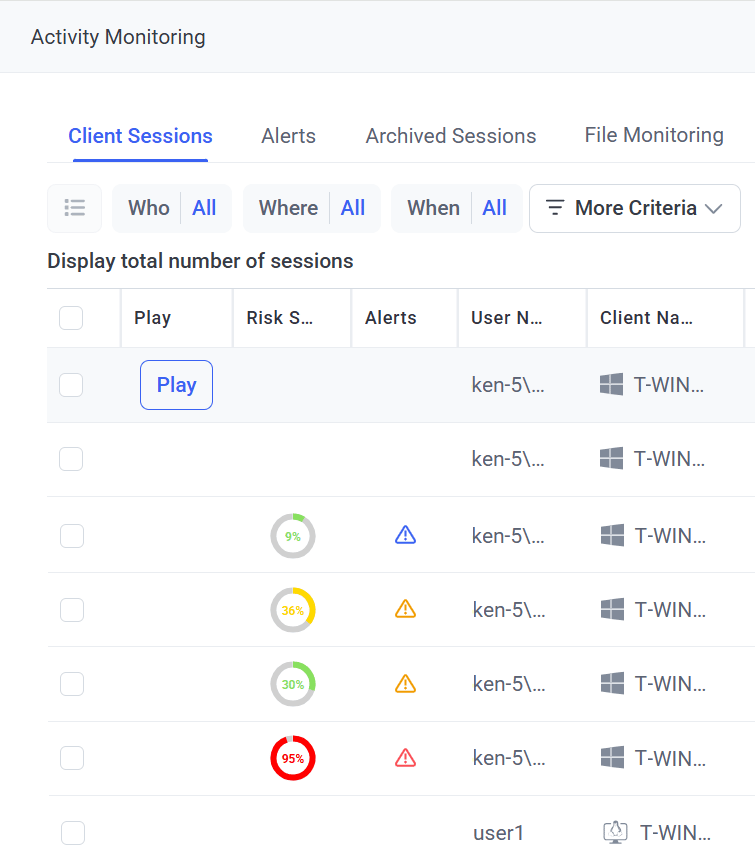
Sessions containing detected behavior anomalies are considered **abnormal** and get a risk score that appears in the **Risk Score** column on the Client Sessions tab (Activity Monitoring page).
### Risk score colors
| Color | Severity | Indicates |
| ---------- | -------- | ------------------------------------------------------ |
| **Red** | Critical | High-confidence anomaly that warrants immediate review |
| **Orange** | High | Notable deviation worth investigation |
| **Green** | Normal | Minor variance, low priority |
Click the Risk Score icon next to a session to open the **Session Risk Score** page, where you can view the specific anomaly patterns and alert events detected, then decide whether to **Approve** or **Skip** the session.
### Rebuild a user profile
User profiles **automatically rebuild every 10 days**, starting daily at midnight. The rebuild incorporates approved sessions and sessions without anomalies that have accumulated since the last build.
To rebuild a profile **manually** — useful after a deliberate behavior change (the user's role changed, they moved to a new shift), or after approving a batch of legitimate-but-previously-flagged sessions — click the **Rebuild** button in the top right of the User Profile page.
## Abnormal sessions
Sessions containing detected behavior anomalies are considered **abnormal** and get a risk score that appears in the **Risk Score** column on the Client Sessions tab (Activity Monitoring page).
### Risk score colors
| Color | Severity | Indicates |
| ---------- | -------- | ------------------------------------------------------ |
| **Red** | Critical | High-confidence anomaly that warrants immediate review |
| **Orange** | High | Notable deviation worth investigation |
| **Green** | Normal | Minor variance, low priority |
Click the Risk Score icon next to a session to open the **Session Risk Score** page, where you can view the specific anomaly patterns and alert events detected, then decide whether to **Approve** or **Skip** the session.
 ### Approve a session
If the user's behavior in a flagged session is actually normal — they were working late on a legitimate project, accessed an unusual server for a sanctioned reason — approve the session. The behavior is then considered normal and will be incorporated into the user's profile on the next rebuild.
Click **Activity Monitoring** in the left navigation.
On the **Client Sessions** tab, click the **Risk Score** icon next to the session.
On the **Session Risk Score** page, click **Approve**.
### Skip a session
If the user's behavior is a genuine anomaly — a security incident, suspected compromise, deliberate misuse — skip the session. The session is excluded from profile building so the user's profile stays clean of the abnormal pattern.
Click **Activity Monitoring**, find the session on the **Client Sessions** tab, and click the **Risk Score** icon next to it.
On the **Session Risk Score** page, click **Skip**.
### Cancel an approval or skip
If you Approved or Skipped a session by mistake, undo it — the original risk score is restored.
On the **Client Sessions** tab, in the **Risk Score** column, click **Approved** or **Skipped** for the required session.
On the **Session Risk Score** page, click **Undo**.
## How investigators receive anomaly information
Three channels surface anomaly information to investigators:
| Channel | What you see |
| --------------------------------------- | ------------------------------------------------------------------------------------------------------------------------------------------------------------------------------------------------------------------------------------------------------------------------------------------------------------------------------------------------------ |
| **Client Sessions tab** | Risk Score column shows a colored icon (red/orange/green) for every session with detected anomalies. Click the icon to open the Session Risk Score page with the abnormal patterns and alert events detected. |
| **Email notifications** | If enabled in the rule, each email contains the session metadata (risk score, user name, Client name, time, anomalies, alerts) plus links to the Session Risk Score page and the recorded session in the [Session Viewer](/docs/session-monitoring/player/overview). Customize email subjects in **Configuration → Customization → Custom Email Subjects**. |
| **User Behavior Analytics Grid Report** | Generate this [report type](/docs/session-monitoring/reports/overview#report-types) on the Reports page for all sessions with detected anomalies in a chosen period. |
## Related
Defined-bad-behavior detection — pairs with UEBA's deviation-from-normal detection.
Where you review the recorded sessions UEBA flags as abnormal.
The User Behavior Analytics Grid Report for periodic anomaly reviews.
Note: UEBA is disabled while Pseudonymizer is enabled (the features aren't currently compatible).
### Approve a session
If the user's behavior in a flagged session is actually normal — they were working late on a legitimate project, accessed an unusual server for a sanctioned reason — approve the session. The behavior is then considered normal and will be incorporated into the user's profile on the next rebuild.
Click **Activity Monitoring** in the left navigation.
On the **Client Sessions** tab, click the **Risk Score** icon next to the session.
On the **Session Risk Score** page, click **Approve**.
### Skip a session
If the user's behavior is a genuine anomaly — a security incident, suspected compromise, deliberate misuse — skip the session. The session is excluded from profile building so the user's profile stays clean of the abnormal pattern.
Click **Activity Monitoring**, find the session on the **Client Sessions** tab, and click the **Risk Score** icon next to it.
On the **Session Risk Score** page, click **Skip**.
### Cancel an approval or skip
If you Approved or Skipped a session by mistake, undo it — the original risk score is restored.
On the **Client Sessions** tab, in the **Risk Score** column, click **Approved** or **Skipped** for the required session.
On the **Session Risk Score** page, click **Undo**.
## How investigators receive anomaly information
Three channels surface anomaly information to investigators:
| Channel | What you see |
| --------------------------------------- | ------------------------------------------------------------------------------------------------------------------------------------------------------------------------------------------------------------------------------------------------------------------------------------------------------------------------------------------------------ |
| **Client Sessions tab** | Risk Score column shows a colored icon (red/orange/green) for every session with detected anomalies. Click the icon to open the Session Risk Score page with the abnormal patterns and alert events detected. |
| **Email notifications** | If enabled in the rule, each email contains the session metadata (risk score, user name, Client name, time, anomalies, alerts) plus links to the Session Risk Score page and the recorded session in the [Session Viewer](/docs/session-monitoring/player/overview). Customize email subjects in **Configuration → Customization → Custom Email Subjects**. |
| **User Behavior Analytics Grid Report** | Generate this [report type](/docs/session-monitoring/reports/overview#report-types) on the Reports page for all sessions with detected anomalies in a chosen period. |
## Related
Defined-bad-behavior detection — pairs with UEBA's deviation-from-normal detection.
Where you review the recorded sessions UEBA flags as abnormal.
The User Behavior Analytics Grid Report for periodic anomaly reviews.
Note: UEBA is disabled while Pseudonymizer is enabled (the features aren't currently compatible).