

Before you start
Import Syteca data into a Power BI report template
Open the report template in Power BI Desktop
.pbit or .pbix file) in Power BI Desktop.Copy the API key from the Management Tool
Open Edit Parameters in Power BI
Set the ApiKey and ApiUrl
ApiKey— paste the value you copied from the Management Tool.ApiUrl— set to the Data Connector URL in the formhttps://<hostname>/ekranapi(where<hostname>matches the Issued To field of the HTTPS certificate you set up during installation).
/ekranapi path suffix — without it, Power BI calls will return 404.(Optional) Set the time range
From and To fields if you want to constrain the date range. These parameters drive the User Productivity dataset specifically — other datasets in the template may use their own ranges.Apply changes
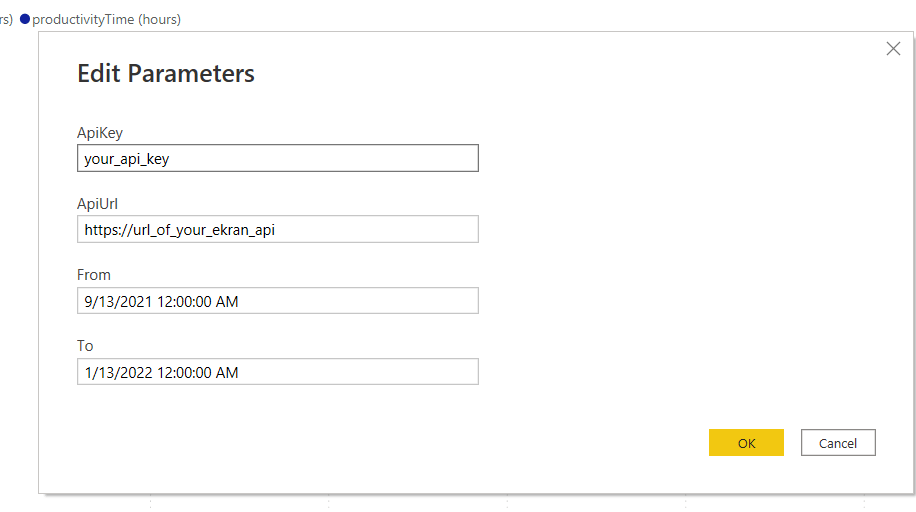
The Edit Parameters dialog in Power BI Desktop — set the ApiKey from the Management Tool and ApiUrl pointing to your Data Connector hostname.
Example reports
Power BI templates from Syteca typically include the following reports:Idle Time and Work Time
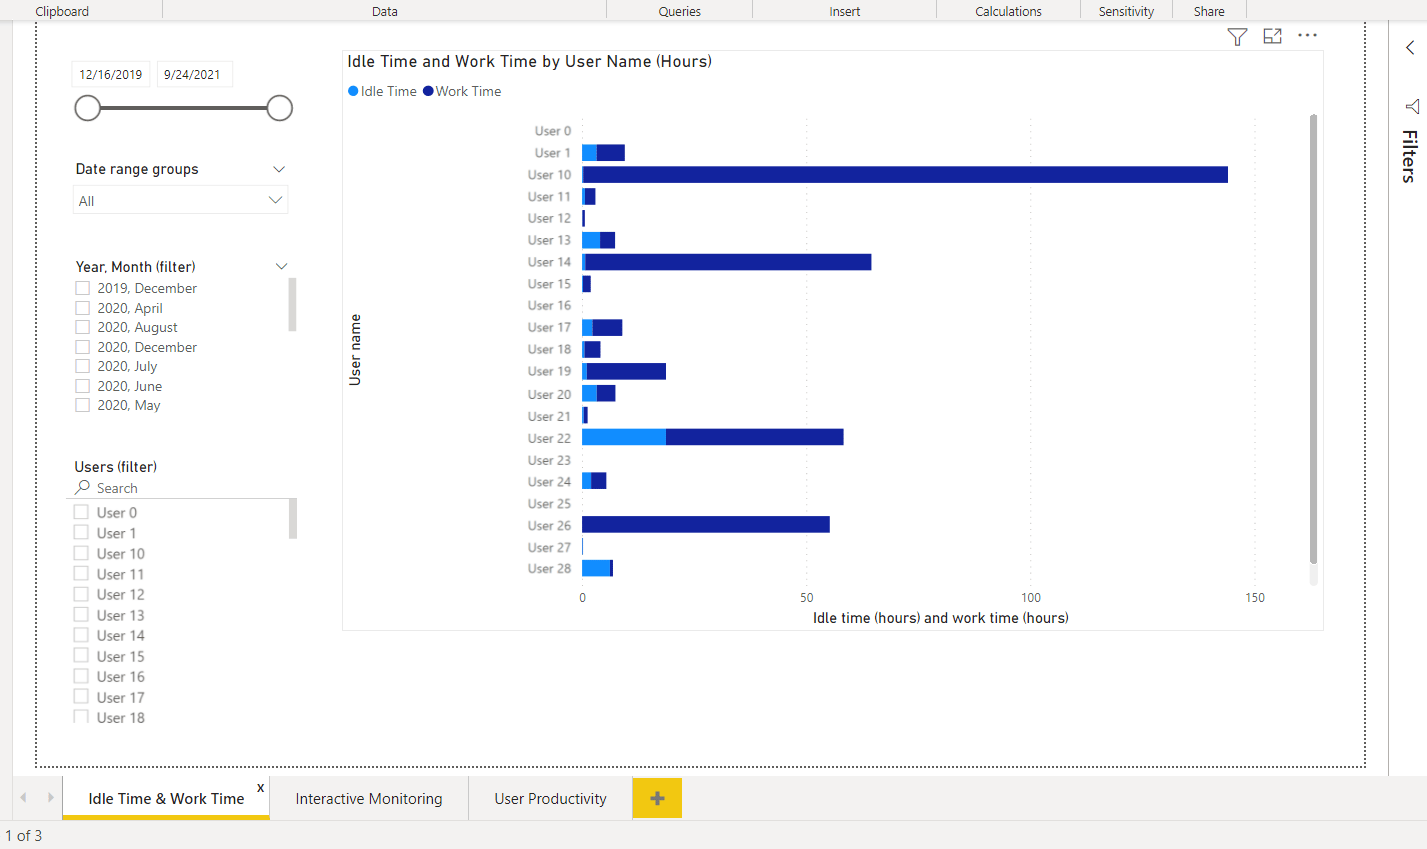
Idle Time and Work Time — per-user breakdown of productive vs idle hours, sourced from POST /sessions and the productivity time field.
POST /sessions (for duration, idleTime, productivityTime per session).
Interactive Monitoring
A timeline-style view of user activity events, blended with alert events for context. Useful for incident review where you need to see “what was this user doing when the alert fired?” Endpoints used:POST /sessions + GET /alerts.
User Productivity
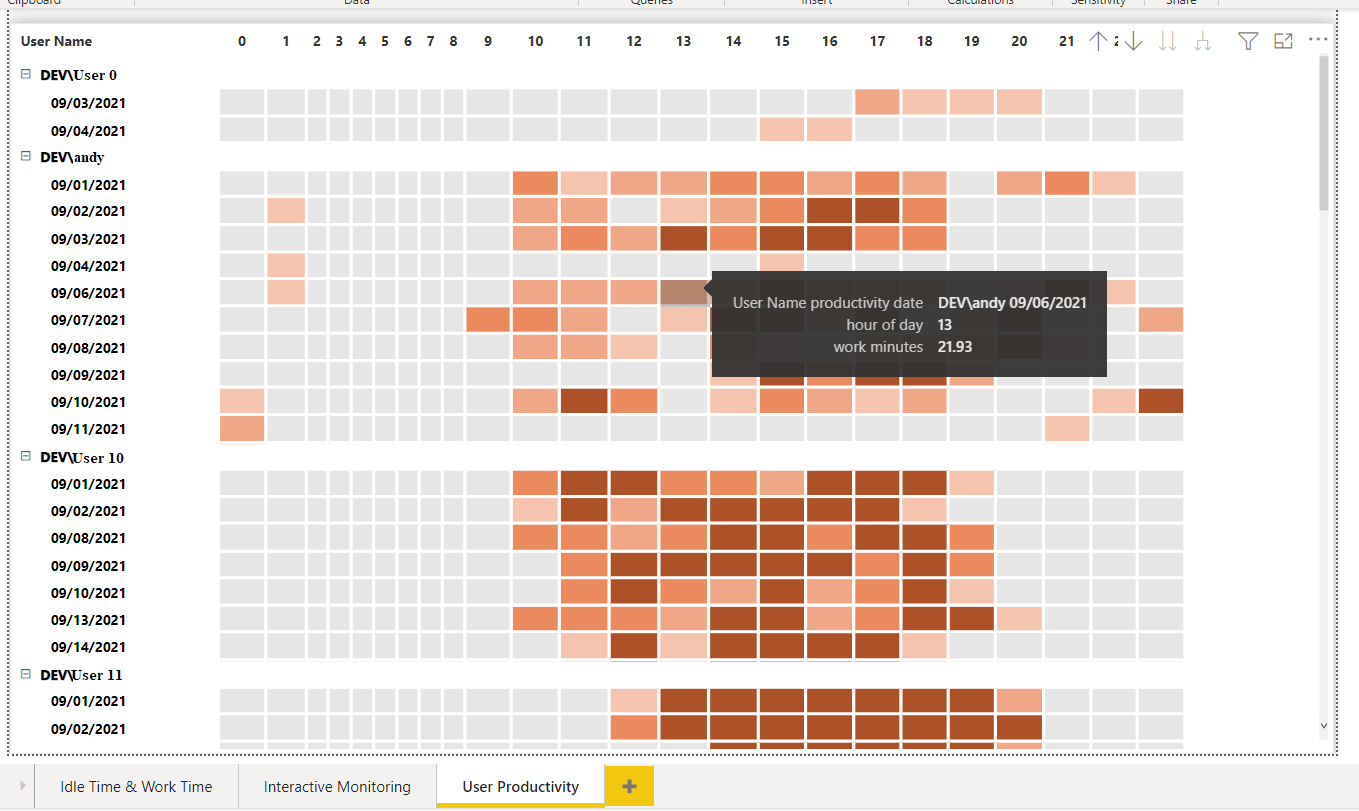
User Productivity — heatmap of active minutes per user across hours of the day, sourced from GET /user/getproductivity.
GET /user/getproductivity (for the (userName, timeOfDay, totalMinutes) triples).
Application Usage
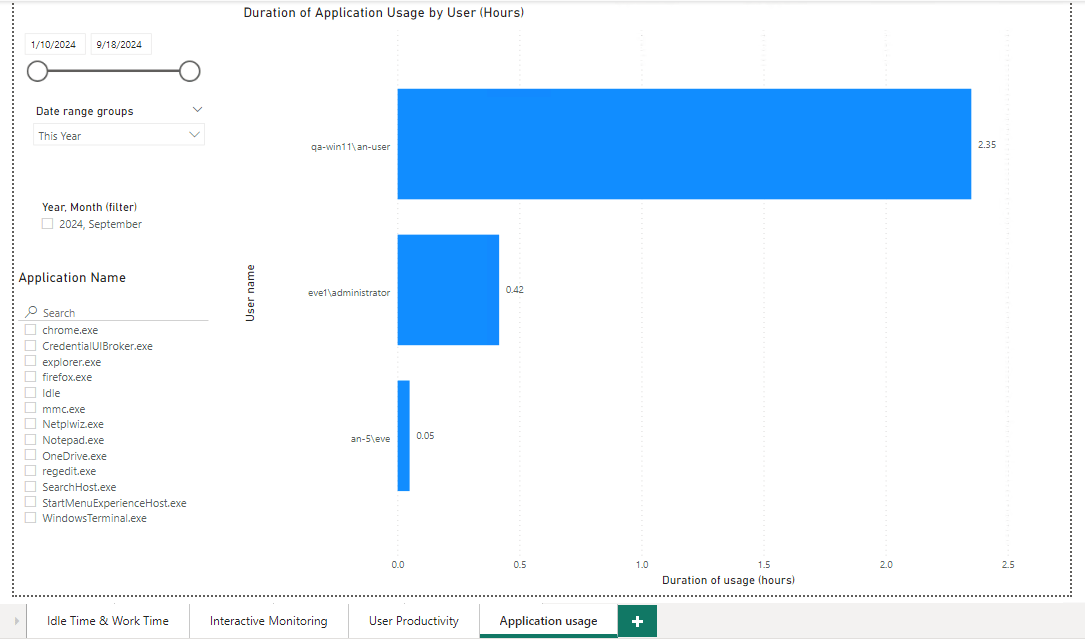
Application Usage — top applications by total time, sourced from GET /statistics/getapp.
GET /statistics/getapp (and optionally GET /statistics/geturl for a URL-equivalent report).
Building your own Power BI reports
The reports above are starting templates — you can build any Power BI visualization that fits the API’s data shape:Refreshing the data
Power BI reports built on the Data Connector follow Power BI’s standard refresh model:- Manual refresh in Desktop: click Refresh in the Home ribbon to re-call every endpoint and update visuals.
- Scheduled refresh in the Power BI service: publish the report to Power BI service and configure a scheduled refresh. The Data Connector must be reachable from the Power BI service host — for on-premises deployments, that typically means an On-premises data gateway between Power BI service and your network.
Fix an SSL/TLS certificate error
If Power BI shows an SSL/TLS certificate error when connecting to the Data Connector, check the following:Use the certificate's hostname, not an IP address
https://<hostname>/ekranapi.Confirm the certificate is trusted
Adjust Power BI's security and privacy settings
- Security page — set Certificate Revocation to None, and Data Extensions to Allow any extension to load without validation or warning.
- Privacy page — set Privacy Levels to Always ignore Privacy Level settings.