

The Audit log can only be viewed by users with the User Management administrative permission.
View the Audit log
1
Open the page
Sign in to the Management Tool and click the Audit Log navigation link on the left.
2
Read the grid
The page shows a transaction-log grid with one row per action and the following columns:
3
Page through results
Click 10 / 50 / 100 / 200 at the bottom right to change records per page, and use the page numbers at the bottom left to navigate.
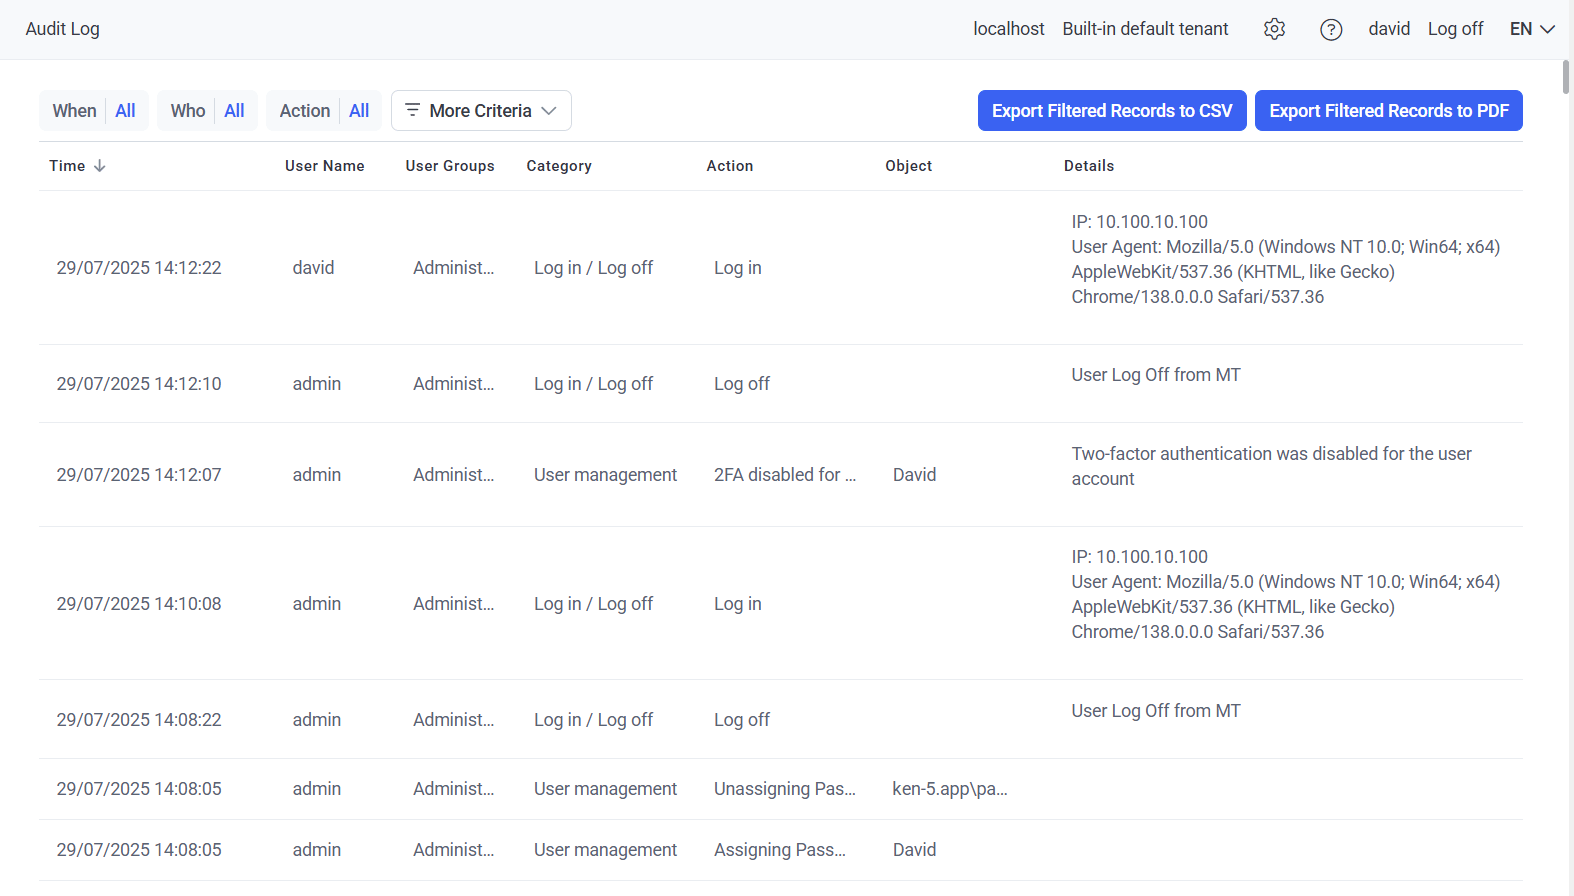
The Audit Log page with the transaction-log grid.
Filter, sort, and export
The grid supports filtering, sorting, column reordering, and export to CSV or PDF.Filter
By default the grid shows three filters. Click a filter and select values to narrow the results — multiple filters can be applied at the same time.
Click More criteria (to the right of the filters) to add:
- User Groups — filter by the groups the administrator belongs to.
- Category — filter by the category of action (see reference below).
- Object — filter by the objects the action affected.
Sort and reorder
- Sort — click a column header. Click it again to switch ascending/descending. The up/down arrow icon in the header shows the current sort direction.
- Reorder columns — drag a column header to a new position.
If the data is not sorted by a column, the sort arrow is not shown in that column header.
Export
Click Export Filtered Records to CSV or Export Filtered Records to PDF at the top right of the page to download the currently filtered view.Audit log protection
The Audit log is protected against tampering with an integrity check, and the data is encrypted in the database — with unique database encryption for each Application Server. If the log has been modified, a red warning appears at the top of the page:THE LOG IS NOT VALID. DATA HAS BEEN CHANGED.All invalid log entries are highlighted in red in the grid so you can identify which records were altered.
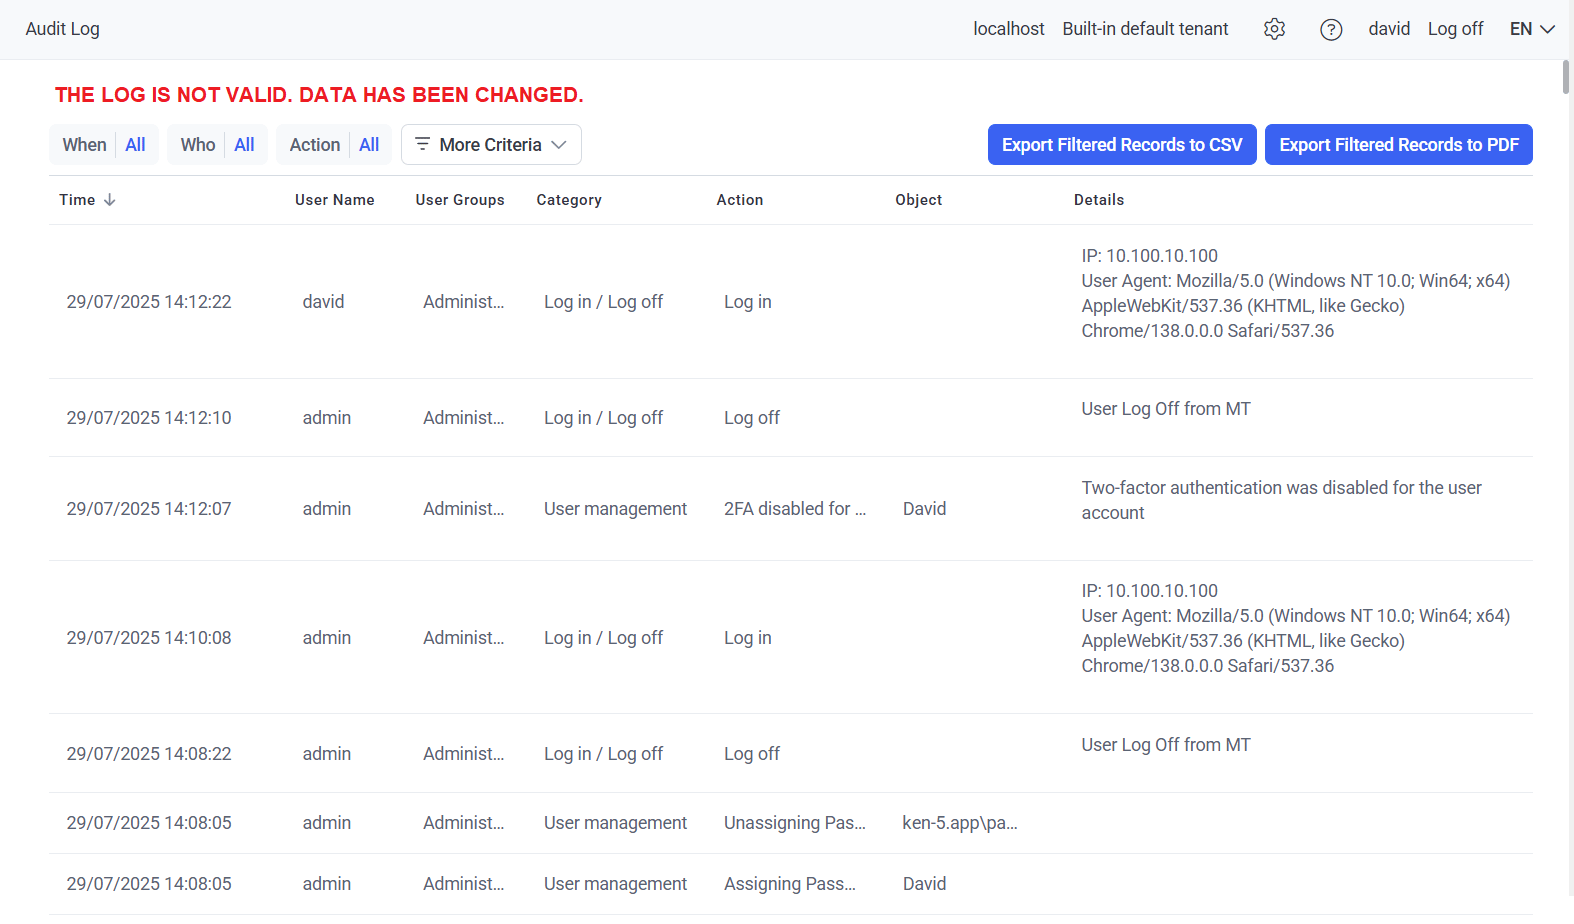
The Audit Log page when log integrity has failed, with invalid entries highlighted.
Category reference
Every action is grouped into a category. The list below covers the main categories and what information each one captures.The Alert player viewing category was deprecated in Syteca version 6.58.1 — these actions are no longer added to the log.
Related
User activity dashboards
Charts of endpoint user activity, application use, and session patterns.
System Health dashboards
Storage, CPU, memory, database, and Client status.
SIEM integration
Forward audit log events to Splunk, ArcSight, or QRadar.
Administrative permissions
The User Management permission required to view this log.