

Watch the Application Server before it becomes a problem
Application Server performance degrades gradually before it fails. CPU usage creeps up as Client counts grow, the database write queue lengthens under peak load, screen capture storage fills up over months, and memory pressure surfaces after long uptimes without a restart. All of these are visible from a single page in the Management Tool: the System State page. The four dashboards there are what a Syteca administrator looks at first when investigating a suspected performance issue, and are what to keep an eye on during capacity planning.Check the System State page when your deployment shows any of these symptoms:
- Slow Management Tool response, especially when opening large session lists or the Sessions grid.
- Delayed session appearance in the Sessions grid after a Client records activity.
- Alerts firing later than expected relative to the recorded activity.
- Ongoing capacity planning ahead of adding a large batch of Clients.
Open the System State page
Log in to the Management Tool as a user with the administrative Client Configuration Management permission, then navigate to the System State page from the top of the Management Tool interface. Four live dashboards are displayed on the page, each showing a different Application Server resource dimension.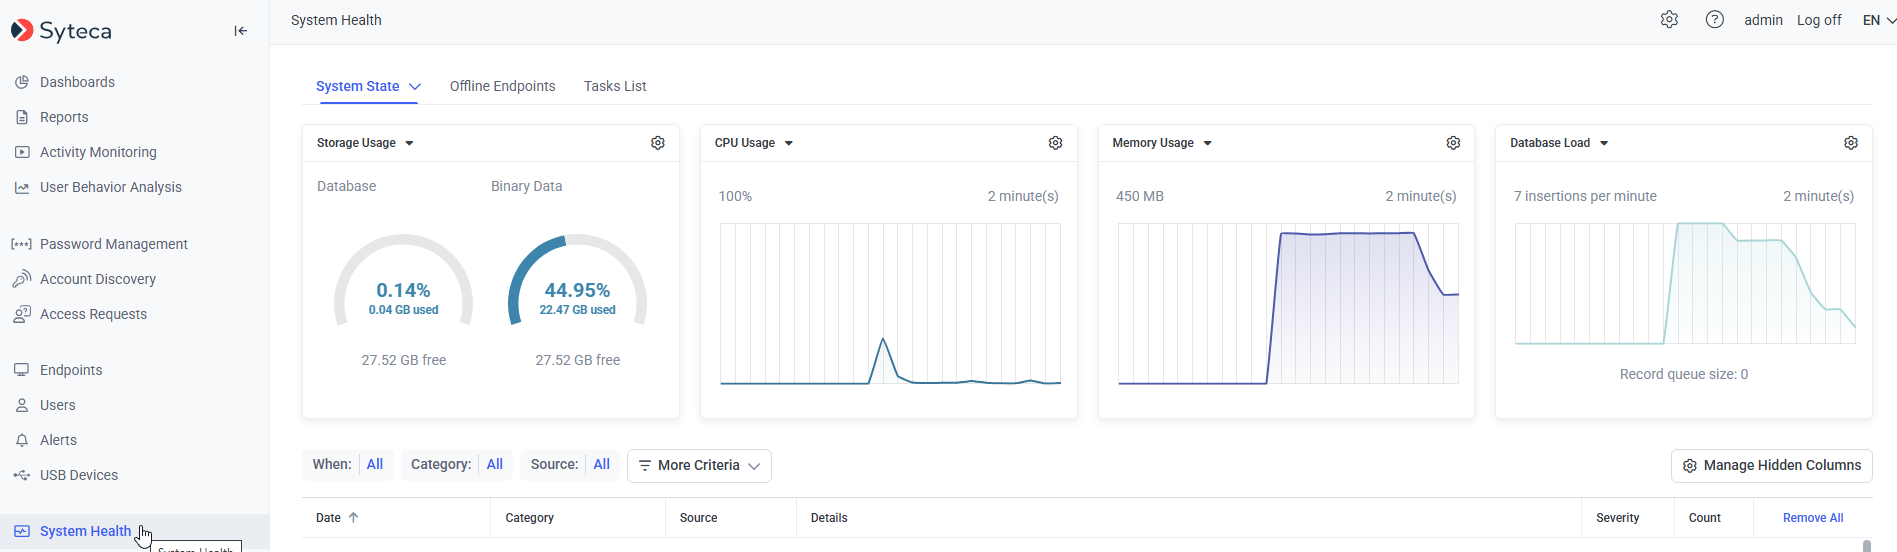
System State page. Four dashboards side by side, each refreshing live every 5 seconds.
CPU Usage
The CPU Usage dashboard shows the percentage of the Application Server host’s CPU consumed by the Application Server process, plotted over the last few minutes.What to look for
Steady CPU under 40 percent during normal working hours indicates healthy headroom for peak load. Sustained CPU above 70 percent is a warning sign; sustained CPU above 90 percent means the Application Server is nearing the point where new session data starts to queue or drop. If CPU is consistently high, the standard next steps are:- Verify Client count is within the sizing envelope for the Application Server hardware. See System Requirements for sizing guidance.
- If the deployment has grown past the single-Application-Server envelope, consider adding additional Application Server instances behind a load balancer. See Install Additional Application Servers for Load Balancing.
- If CPU spikes correlate with alert processing, review recent alert configuration for expensive rules. See Alerts.
Memory Usage
The Memory Usage dashboard shows the Application Server process’s private working set (memory owned by the process, not counting shared memory or memory that could be paged out).What to look for
Memory usage grows with active Client count and with the number of concurrent Sessions being ingested. A stable memory profile that plateaus during peak load is healthy. Monotonic memory growth over hours or days, with no plateau, indicates a memory pressure problem. If memory usage climbs continuously:- Compare against the recommended RAM in System Requirements for the current Client count.
- Check for long-running Application Server uptime without a restart; some memory profiles slowly grow across weeks of uptime.
- If the plateau never returns even at low Client load, contact Syteca support with the ServerLogs archive.
Database State
The Database State dashboard shows the write throughput and queue depth between the Application Server and its database.What to look for
A healthy Application Server has a records/min value that comfortably exceeds the incoming ingestion rate, and a queue size that hovers near 0. A queue size consistently above 30 indicates the database is not keeping up with the write rate; a queue size that repeatedly hits 64 means the Application Server is being throttled by the database and session data ingestion is stalling. Common causes of a growing queue:- Database CPU or I/O saturation. Check the database server’s own CPU, memory, and disk metrics.
- Insufficient database indexes after schema migration. Rebuild indexes and update statistics on large tables.
- Network latency between the Application Server and a remote database server. Measure round-trip time on the database port.
- Database autogrowth events blocking writes. Pre-size the database to a level appropriate for the retention window rather than relying on autogrowth.
Storage Usage
The Storage Usage dashboard shows how much of the two Syteca storage locations is currently in use.What to look for
A binary storage pie chart approaching 100 percent used space is the leading indicator of an imminent outage. When binary storage fills, new screen captures cannot be written and Client sessions cannot record activity fully. Set up alerts on the underlying storage before it reaches this state, and plan retention windows or additional storage well in advance. A database storage pie chart approaching full is a longer-fuse issue but no less serious. When the database fills, the Application Server cannot write new sessions, alerts, or configuration changes, and the Management Tool becomes unresponsive. Both storage types can be addressed by:- Reducing retention window through the cleanup policies.
- Archiving older sessions to a separate archive location.
- Increasing the size of the underlying storage.
Related
System Requirements
Sizing guidance for Application Server CPU, RAM, and storage per Client count.
Application Server troubleshooting
Diagnose common Application Server issues, including database connection loss and Management Tool availability.
High availability
Scale beyond a single Application Server for headroom and fault tolerance.
Shared storage HA
Move screen captures off the database to reduce database growth.